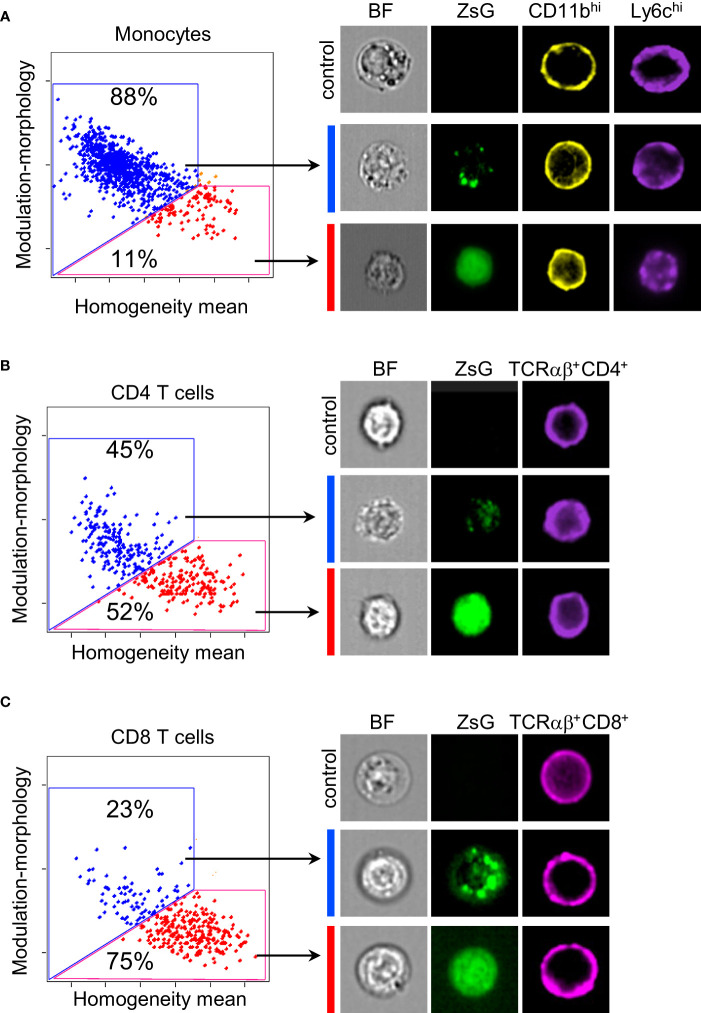
Figure 3.
Subcellular distribution of ZsG in TILs. (A–C) Quantification of frequency of monocytes (A), CD4 (B) and CD8 (C) T cells with different cellular localization of ZsG (left panels) and representative images (right panels). Modulation-morphology feature (blue) and homogeneity feature (red) determine granular versus homogeneous distribution. All images were acquired at 60X magnification. Image display gains for ZsGreen were set to the same parameters with the IDEAS software to allow for visual comparison of intensity between images. Control, cells isolated from B16 tumors; BF, bright field.

