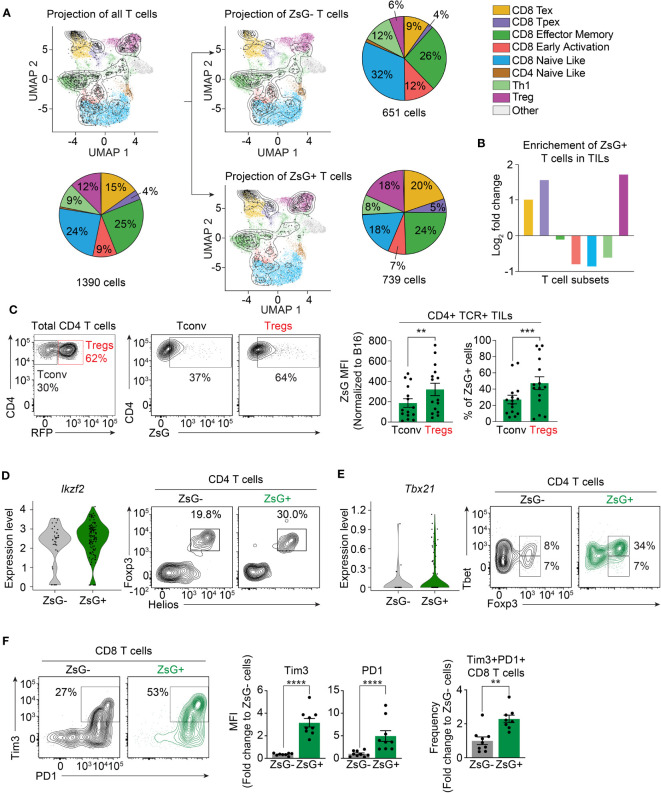
Figure 4.
Exhausted CD8 T cells and Tregs are the most susceptible to intercellular transfer. (A, B) ProjecTILs analysis of T cell scRNA-seq data. (A) Projection of total, ZsG- and ZsG+ T cell scRNA-seq data on the reference atlas with pie charts showing proportions of each TIL subset. (B) Fold-change in the frequency of ZsG+ T cells compared to that of ZsG- T cells for each TIL subtype. (C) Representative flow cytometry analysis showing ZsG transfer into CD4 conventional TILs compared to Tregs from B16ZsG tumors with summary graphs of ZsG MFI and frequency of these populations. (D) Violin plots showing expression level of Ikzf2 in ZsG- and ZsG+ Tregs (scRNA-seq data) with representative flow cytometry analysis demonstrating a higher percentage of Helios+Foxp3+ cells among ZsG+ CD4 TILs compared to ZsG- CD4 TILs from B16ZsG tumors. (E) Violin plots showing expression level of Tbx21 in ZsG- and ZsG+ Tregs (scRNA-seq data) with representative flow cytometry analysis demonstrating a higher percentage of Tbet+Foxp3+ cells among ZsG+ CD4 TILs compared to ZsG- CD4 TILs from B16ZsG tumors. (F) Representative flow cytometry analysis showing Tim3 and PD-1 expression in ZsG- and ZsG+ CD8 TILs from B16ZsG tumors with summary graphs of Tim3 and PD-1 MFI and frequency of the Tim3+PD-1+ population presented as fold changes relative to CD8 TILs from B16 control tumors. (C, F) Mean ± s.e.m, paired T-test (C), Mann-Whitney U test (F): **p<0.01, ***p<0.001, ****p<0.0001. Data represent three independent experiments (C–F) and are pooled from at least three independent experiments (C, F).

