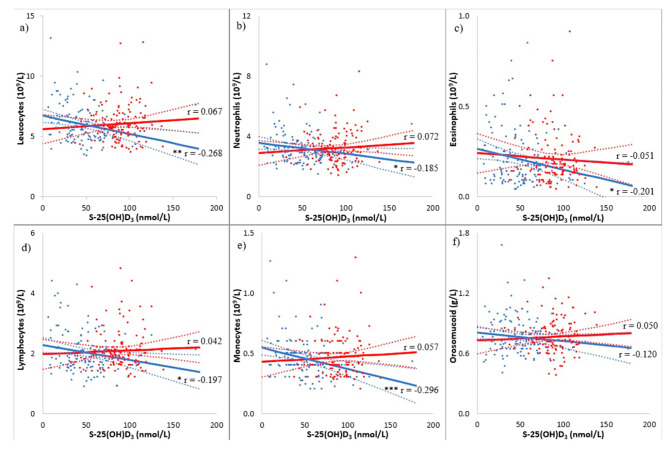
Fig. 2.
Scatterplots of inflammatory markers in the vitamin D3 group and placebo group after 150 days of treatment. Vitamin D3 group presented as red dots with red trend line and 95% confidence intervals for the regression lines. Placebo group presented as blue dots with a blue trend line and 95% confidence intervals for the regression lines, both as a function of serum 25(OH)D3 in a pooled linear regression model. (a) Leucocytes. (b) Neutrophils. (c) Eosinophils. (d) Lymphocytes. (e) Monocytes. (f) Orosomucoid. r-values: Pearson’s correlation coefficient. P-values: Pearson’s correlation with a two-tailed test of significance. * p < 0.05, ** p < 0.01, and *** p < 0.001. Regression p-values for leucocytes and monocytes were 0.016 and 0.013, respectively. Neutrophils and lymphocytes were borderline significant, 0.059 and 0.077, respectively. Regression p-values were calculated with Student’s t-test. Abbreviations: S-25(OH)D3, serum 25-hydroxyvitamin D3

