Fig. 6.
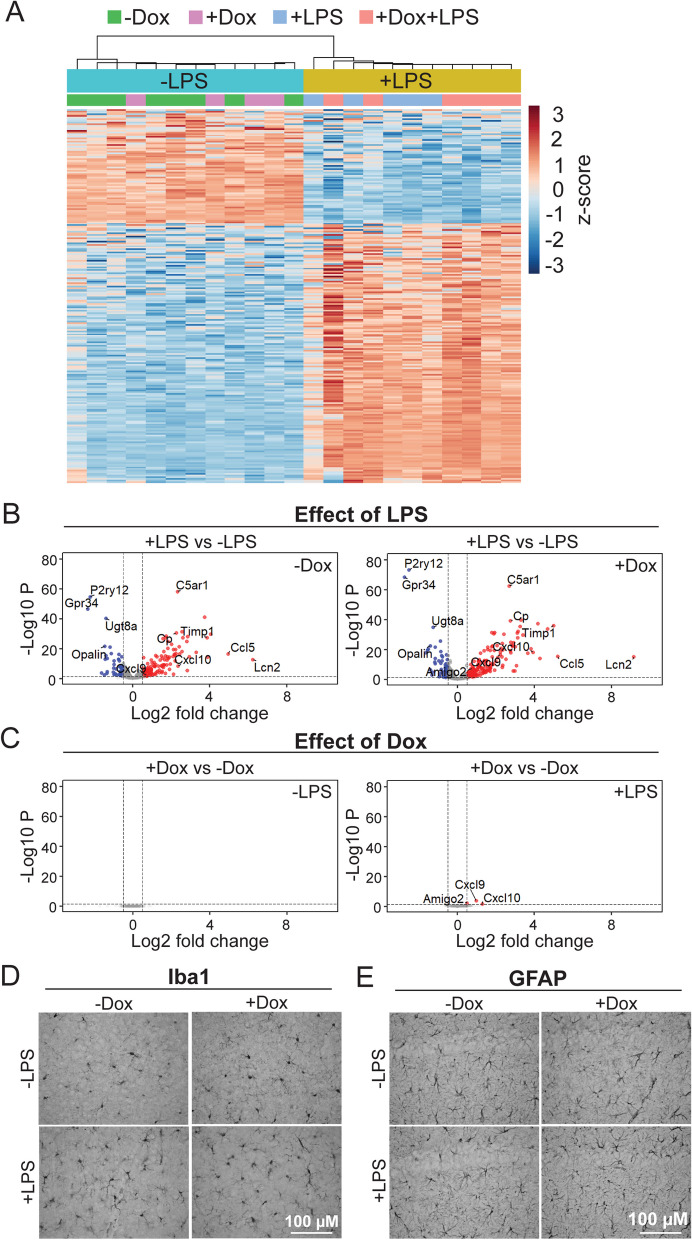
Transcriptional response to LPS challenge is unaffected by prior dox treatment. A Transcriptomic analysis of neuroinflammatory genes in cortical tissue of 12-wk-old WT mice challenged with systemic LPS or saline 18 h prior to harvest. Heatmap shows log-transformed counts of differentially expressed genes for each sample, colors represent row-normalized z score. Unbiased hierarchical clustering separated animals by LPS treatment, but not dox condition. B Volcano plots show that the same genes are up- or down-regulated by LPS challenge in both dox-treated and untreated mice. Genes with an adjusted p-value < 0.05 and an absolute value of logFC > 0.5 were considered statistically significant and are indicated with red (upregulated) and blue (downregulated) dots. C Volcano plots show that few genes differ significantly as a function of dox treatment within LPS-challenged or saline-injected animals. D, E Representative 40 × images of Iba1 immunostaining in the cortex (D) and GFAP immunostaining in the hippocampus (E) of WT mice show little difference in morphology or distribution of either cell type between conditions. n = 5–7 per group. Scale bar: 100 µm

