Fig. 7.

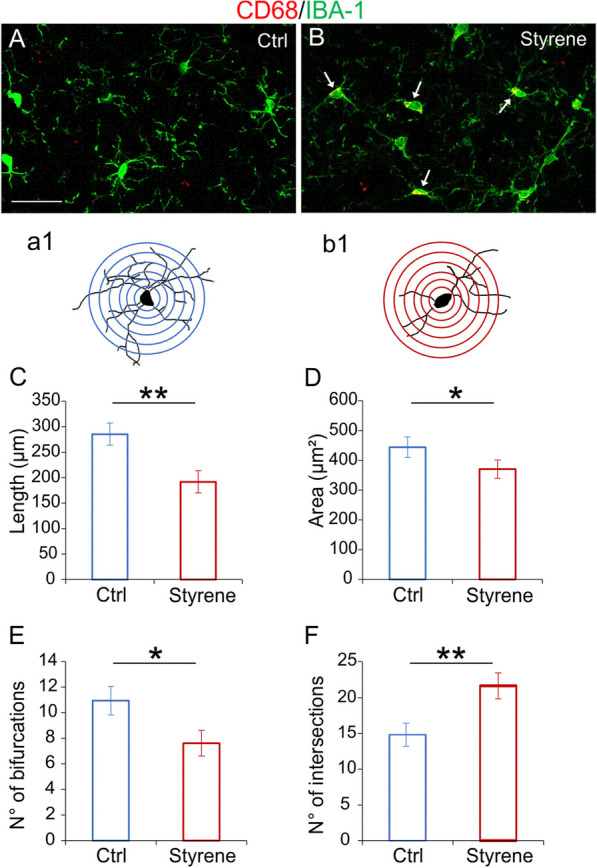
Altered microglia morphology in the auditory cortex of styrene-treated animals. A, B Representative images of brain coronal sections showing IBA-1 (green fluorescence) and CD68 (red fluorescence), expression in the auditory cortex (ACx) of control (A, Ctrl) and styrene-treated animals (B). Arrows in B indicate the co-localization of CD68 in IBA-positive cells. Scale bar: 50 μm. a1, b1 Schematic representation of camera lucida drawings of single cell from control (a1) and styrene-treated animal (b1) analyzed with Sholl analysis. C–F Bar graphs (mean ± SEM) indicate differences in dendritic length (C, Student’s t test, p = 0.002), average of total surface area (D, Student’s t test, p = 0.017), total number of bifurcating nodes (E, Student’s t test, p = 0.02) and total number of dendritic intersections (F, Student’s t test, p = 0.007) of IBA1-positive cells in both experimental groups. Asterisks indicate significant comparisons (*p < 0.05; **p < 0.01)
