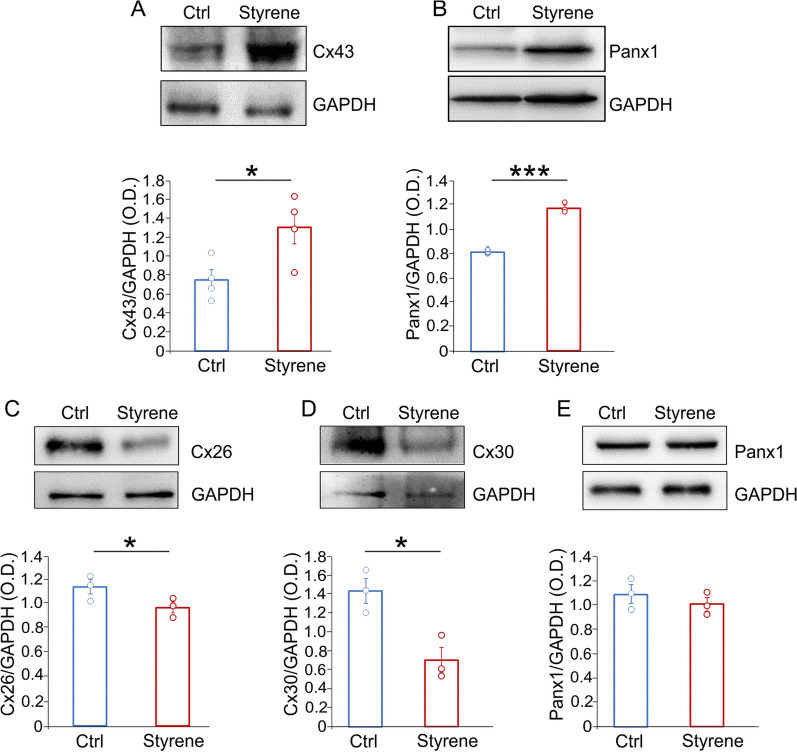
Fig. 9.
Different alterations of connexin and pannexin expression in the cochlea and auditory cortex after the oto/neurotoxic insult. A, B Representative bands of western blot showing high levels of Cx43 and Panx1 in the auditory cortex (ACx) of styrene-treated animals compared to controls. Bar graphs show optical density values in all samples (Cx43 n = 3 animals/group; Student’s t test, p = 0.03; Panx1 n = 3 animals/group; Student’s t test, p = 0.0001) normalized to the corresponding total protein levels (GAPDH). C–E Western blots showing expression levels of Cx26, Cx30 and Panx1 in cochlear lysates of styrene-treated animals compared to controls. Bar graphs show densitometric analyses (Cx26, n = 3 animals/group; Student’s t test, p = 0.04; Cx30, n = 3 animals/group; Student’s t test, p = 0.017; Panx1, n = 3 animals/group; Student’s t test, p > 0.05). Asterisks indicate significant differences between groups (*p < 0.05; ***p < 0.001)

