Fig. 1.
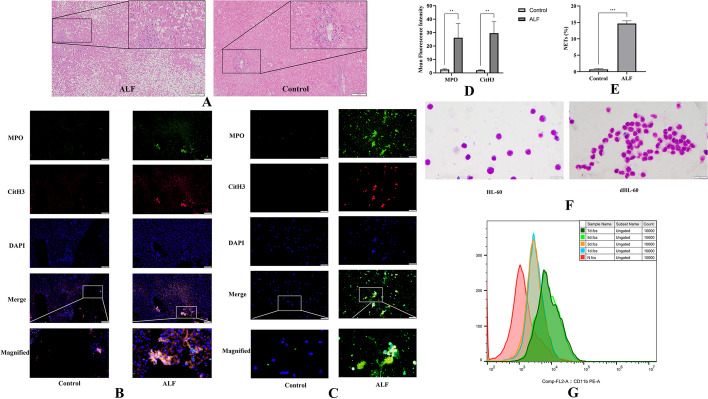
Increased formation of NETs in patients with acute liver failure and differentiation of HL-60 cells in the presence of DMSO. A HE staining of liver samples in the healthy controls and patients with acute liver failure; the scale bar is 100 μm. B Liver samples from healthy controls and patients with acute liver failure were assessed by immunofluorescence staining with MPO (green), CitH3 (red), and DAPI (blue) to detect the formation of NETs. The scale bar is 50 μm. C Representative immunofluorescence images showing the formation of NETs from neutrophils of the healthy controls and patients with ALF. NETs formation detected by MPO (green), CitH3 (red), and DAPI (blue); the scale bar 50 μm. D The mean fluorescence intensity of Cit-H3 and MPO was quantified using ImageJ analysis software. Five microscopic fields per liver section were counted. E NETs and neutrophils were counted after immunofluorescence staining with MPO and CitH3. The percentage of NETs was calculated as the average of five fields normalized to the total number of neutrophils. F HL-60 and HL-60 cells were treated with 1.25% DMSO for 5 days (dHL-60). Cell morphology was shown by Giemsa staining; the scale bar is 10 μm. G CD11b expression was used as a neutrophil surface marker to measure the differentiation status of HL-60 cells on days 0, 1, 3, 5, and 7. NETs Neutrophil extracellular traps, MPO Myeloperoxidase, CitH3 Citrullinated histone H3, DAPI 4′,6-diamidino-2-phenylindole. The histograms show the means ± SD, **P < 0.01, ***P < 0.001

