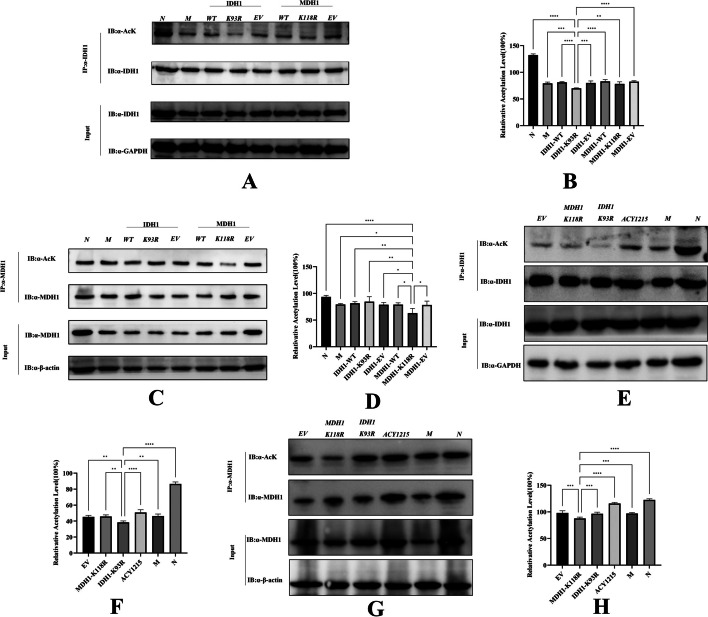
Fig. 2.
Mutation of IDH1-K93R and MDH1-K118R resulted in reduced acetylation levels. A dHL-60 cells were analyzed by western blotting using a pan-antiacetyl lysine antibody to detect the acetylation level of IDH1 purified by the IDH1 antibody. B Relative ratios of IDH1 acetylation were calculated after normalization to IDH1. C dHL-60 cells were analyzed by western blotting using a pan‐antiacetyl lysine antibody to detect the acetylation level of MDH1 purified by the MDH1 antibody. D Relative ratios of MDH1 acetylation were calculated after normalization to MDH1. (N: dHL-60; M: dHL-60 + PMA; IDH1-WT: IDH1-wild-type + PMA; IDH1-K93R:IDH1-K93R + PMA; IDH1-EV: IDH1-Flag + PMA; MDH1-WT: MDH1-wild-type + PMA; MDH1-K118R:MDH1-K118R + PMA; MDH1-EV: MDH1-HA + PMA.) E Liver samples were analyzed by western blotting using a pan‐antiacetyl lysine antibody to detect the acetylation level of IDH1 purified by IDH1 antibody. F Calculation of the relative ratio of IDH1 acetylation after normalization to IDH1. G Liver samples were analyzed by western blotting using a pan‐antiacetyl lysine antibody to detect the acetylation level of MDH1 purified from the MDH1 antibody. H Calculation of relative ratios of MDH1 acetylation after normalization to MDH1. N: liver samples injected with normal saline; M: ALF model, liver samples injected with LPS/d-gal; ACY1215: LPS/d-gal + ACY1215; IDHI-K93R: IDHI-K93R adenovirus-infected mice + LPS/d-gal; MDHI-K118R: MDHI-K118R adenovirus-infected mice + LPS/d-gal group, EV: empty adenovirus-infected mice + LPS/d-gal. The histograms show the means ± SD. *P < 0.05, **P < 0.01, ***P < 0.001, and ****P < 0.0001

