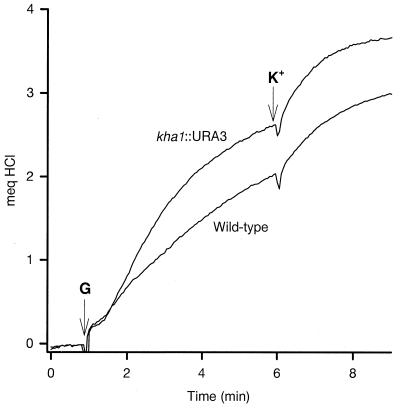
FIG. 5.
Changes of the pH of cell suspensions. pH changes were monitored by the absorbance changes of 8 μg of bromcresol purple at 487 to 586 nm in a mixture containing 25 mg of cells and 2 mM tartrate-MES-TEA buffer (pH 6.0) in a final volume of 2.0 ml at 30°C. The tracing started at 1 min with the addition of 50 mM glucose (G), and 15 mM KCl (K+) was added at 6 min, as indicated. The changes were calibrated by additions of 100 mM HCl.

