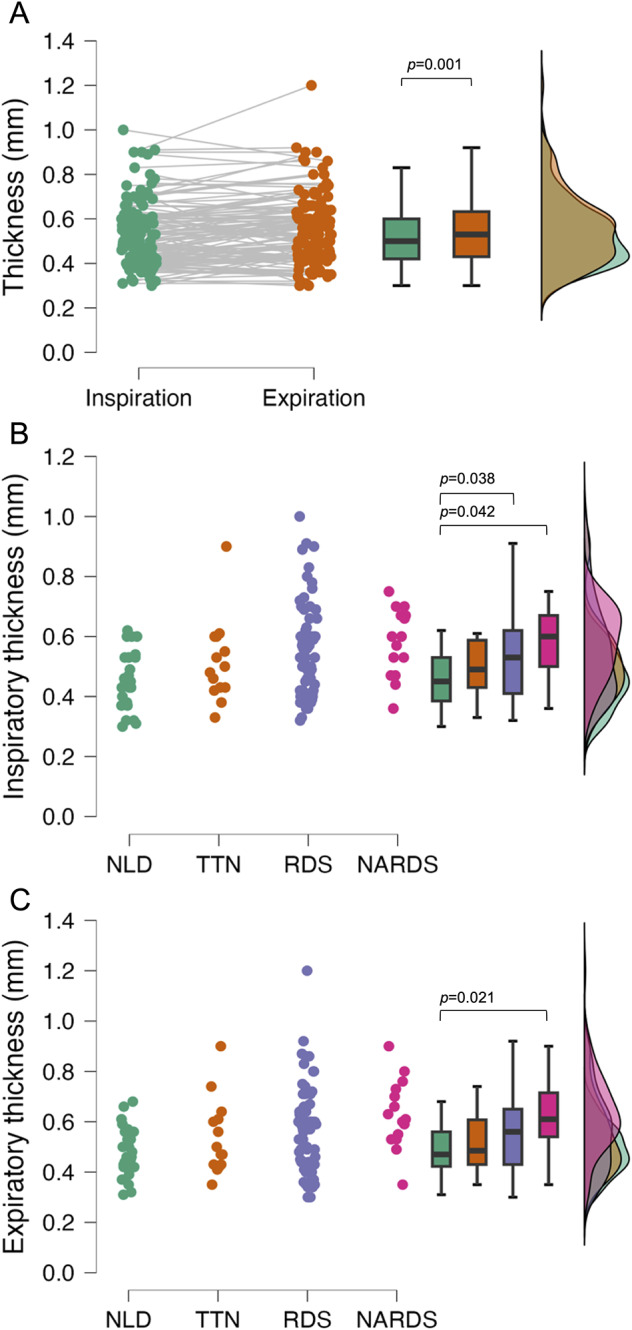
Fig. 2.

Pleural line thickness. A depicts data for the whole population (n = 124) during inspiration (green dots) and expiration (orange dots); data were compared with paired Wilcoxon test (p = 0.001). B and C illustrate the end-inspiratory and end-expiratory thickness, respectively, for patients divided according to the respiratory diagnosis (green, orange, violet and pink dots for patients without lung disease or with transient tachypnoea of the neonate, respiratory distress syndrome and neonatal acute respiratory distress syndrome, respectively). Box plots depict (from top to bottom) 95th, 75th, 50th, 25th, and 5th percentiles. The raincloud curves on the right side represent the density (distributions) of datapoints; for the color saturation effect, the overlaying curves may result in colors which do not correspond to the box and dot plots, but they visually describe the data overlap. Data were analyzed with Kruskal–Wallis test (overall p = 0.021 for both inspiratory and expiratory thickness); horizontal lines indicate significant post hoc comparisons (Conover-Iman test). Abbreviations: NARDS: neonatal acute respiratory distress syndrome; NLD: no lung disease; RDS: respiratory distress syndrome; TTN: transient tachypnoea of the neonate
