Fig. 1.

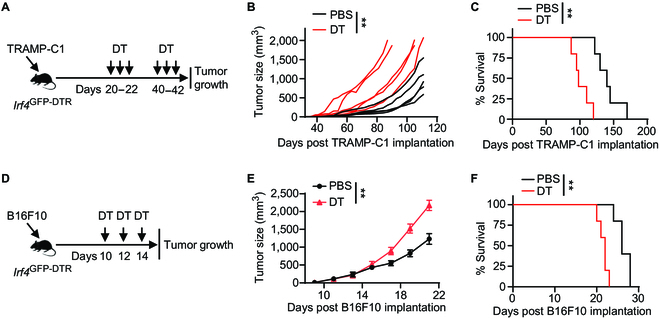
Effects of DT treatment on tumor growth in Irf4GFP-DTR mice. (A to C) Irf4 GFP-DTR mice were subcutaneously (s.c.) implanted with 2 × 10⁶ TRAMP-C1 prostate cancer cells and received treatment with 25 μg/kg DT or PBS vehicle control on the indicated days. (A) Experimental design depicting the timeline of treatments. (B and C) Tumor volumes and survival rates of TRAMP-C1 tumor-bearing mice in the DT and PBS treatment groups (n = 5 per group). (D to F) Irf4 GFP-DTR mice were s.c. injected with 0.1 × 10⁶ B16F10 melanoma cells and treated with 25 μg/kg DT or PBS on the indicated days. (D) Experimental design illustrating the timing of treatments. (E and F) Mean tumor volumes and survival rates of B16F10 tumor-bearing mice in the DT and PBS treatment groups (n = 5 per group). In B, tumor growth curves were compared between the DT and PBS treatment groups using a 2-way ANOVA (mixed-effects model) with the Geisser–Greenhouse correction. In E, data are presented as mean ± SD, and tumor growth curves were compared between the DT and PBS treatment groups using a repeated measures 2-way ANOVA with the Geisser–Greenhouse correction. In C and F, survival rates were compared between the DT and PBS treatment groups using a log-rank test. **P < 0.01.
