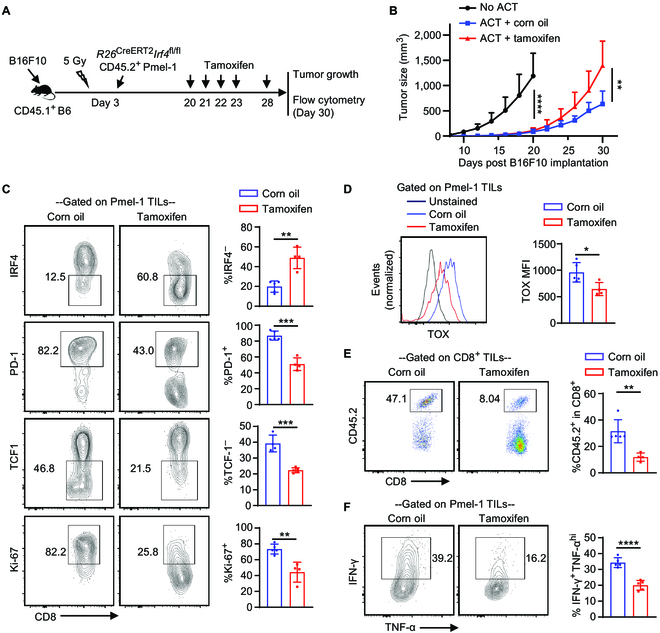
Fig. 6.

Effects of deleting the Irf4 gene in antitumor CD8+ T cells after ACT on melanoma control. CD45.1+ B6 mice were s.c. injected with 0.2 × 10⁶ B16F10 cells on day 0. On day 3, the mice were sub-lethally irradiated and adoptively transferred with (ACT groups) or without (No ACT) 2 × 10⁶ activated R26CreERT2Irf4fl/fl CD45.2+ Pmel-1 cells. The mice in the ACT groups were further treated with 2 mg of tamoxifen (ACT + tamoxifen) or corn oil (ACT + corn oil) on indicated days. Tumor growth was monitored, and TILs were obtained on day 30 for flow cytometry analysis. (A) Experimental design illustrating the timeline of events. (B) Mean tumor volumes of the indicated groups (mean ± SD, n = 10 per group). (C) Percentages of IRF4–, PD-1+, TCF1–, and Ki67+ cells among CD8+CD45.2+ Pmel-1 TILs in corn oil- and tamoxifen-treated ACT groups. (D) TOX expression of Pmel-1 TILs in corn oil- and tamoxifen-treated ACT groups. (E) Percentage of CD45.2+ Pmel-1 cells among total CD8+ TILs in indicated treatment groups. (F) Percentage of IFN-γ+TNF-αhi cells among Pmel-1 TILs in indicated treatment groups. In B, tumor growth curves were compared (No ACT vs. ACT + corn oil, day 8 to day 20; ACT + corn oil vs. ACT + tamoxifen) using a repeated measures 2-way ANOVA with the Geisser–Greenhouse correction. In C to F, data in bar graphs are presented as mean ± SD (n = 4 to 5), and statistical significance was determined using an unpaired 2-tailed Student’s t test. *P < 0.05, **P < 0.01, ***P < 0.001, and ****P < 0.0001.
