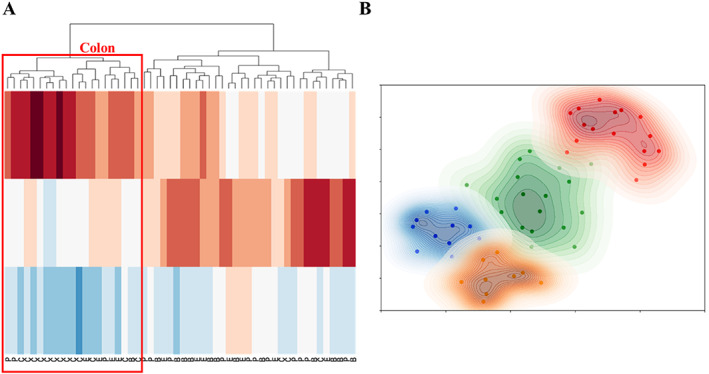
Figure 3.

Hierarchical clustering of top 10 most selected feature from all feature families that generated maximum cluster separation. (A) Heat map of the 3D embedment with true class labels is shown on the bottom of the plot. (B) Agglomerative clustering analysis results when set the number of clusters to be identified into four. Color scheme for cancers as in Figure 2. B, breast; C, colon; E, esophagus; P, pancreas.
