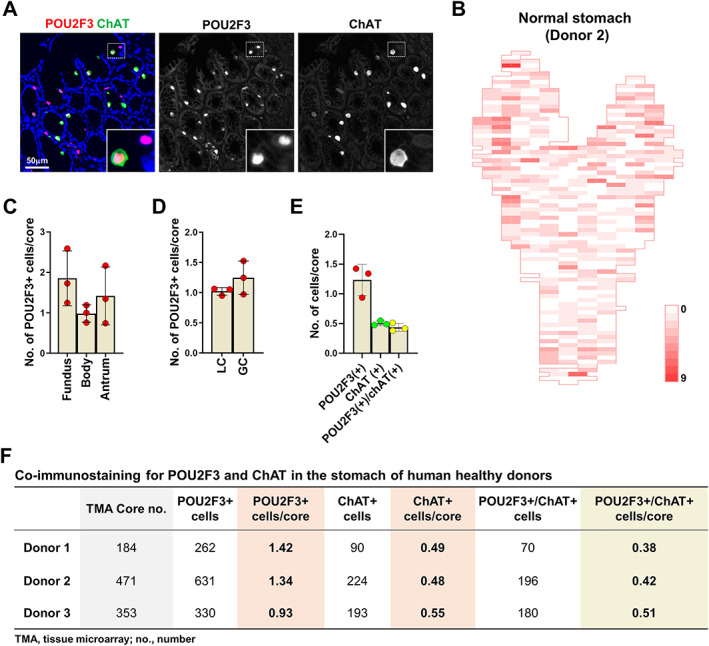
Figure 1.

Distribution of tuft cells in the normal human stomach. (A) Immunostaining for POU2F3 and ChAT in the corpus of normal human stomach. (B) Two‐dimensional map of the numbers of POU2F3‐positive cells in the entire stomach of a human donor (C and D) Quantitation of POU2F3‐positive cells per tissue array core in the stomachs of three human organ donors according to the location of stomach; fundus, body, and antrum (C) or lesser curvature and greater curvature (D). (E) Quantitation of POU2F3‐ or ChAT‐positive cells per tissue array core in the stomachs of three organ donors. (F) Table showing the total number or average number per core of POU2F3‐positive, ChAT‐positive, or double‐positive cells in each stomach.
