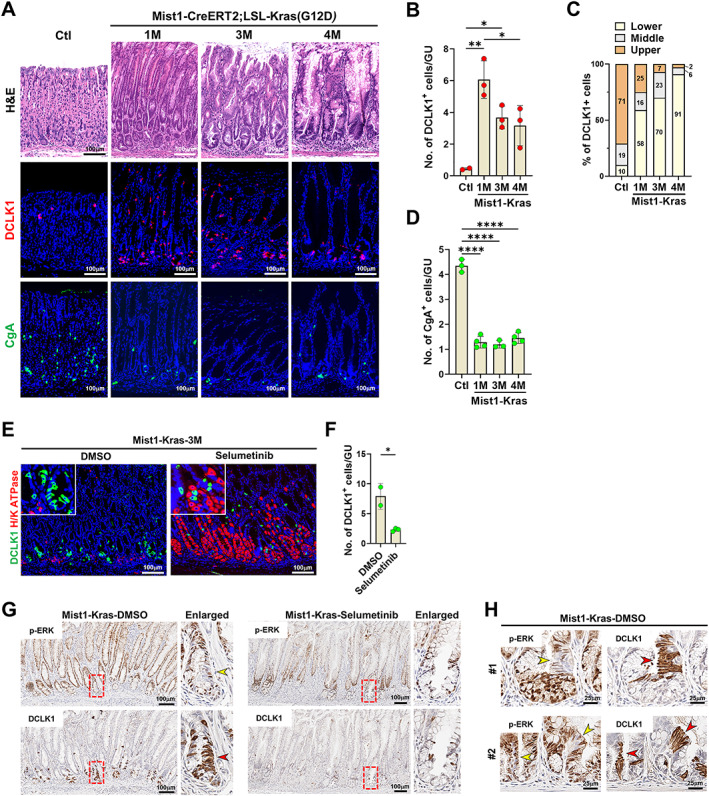
Figure 4.

Expression of tuft cells in the Mist1‐Kras mouse model of metaplasia and cancer. (A) H&E and co‐immunostaining for DCLK1 or CgA in control mice and Mist1‐Kras mice at 1, 3, and 4 months (M) after induction. (B and C) Quantitation of DCLK1‐positive cells (B) and their location in the corpus of control (n = 3) and Mist1‐Kras (n = 3) mouse stomachs. (D) Quantitation of CgA‐positive cells. (E and F) Co‐immunostaining for DCLK1, H/K ATPase at 3 months after induction in Mist1‐Kras mice treated with DMSO (n = 2) or selumetinib (n = 3) for 2 weeks (E) and quantitation of DCLK1‐positive cells in the corpus of stomach (F). (G) Serial sections from Mist1‐Kras mice treated with DMSO or selumetinib for 2 weeks stained for p‐ERK or DCLK1. Red boxes indicate regions shown in enlarged view at right. (H) Serial sections from two Mist1‐Kras mice treated with DMSO stained for p‐ERK or DCLK1 demonstrating the lack of p‐ERK expression in tuft cells. No., number, GU, gastric unit. Mean ± SD. Unpaired Student's t‐test or one‐way ANOVA with Tukey's multiple comparisons test. *p < 0.05, **p < 0.01, ****p < 0.0001.
