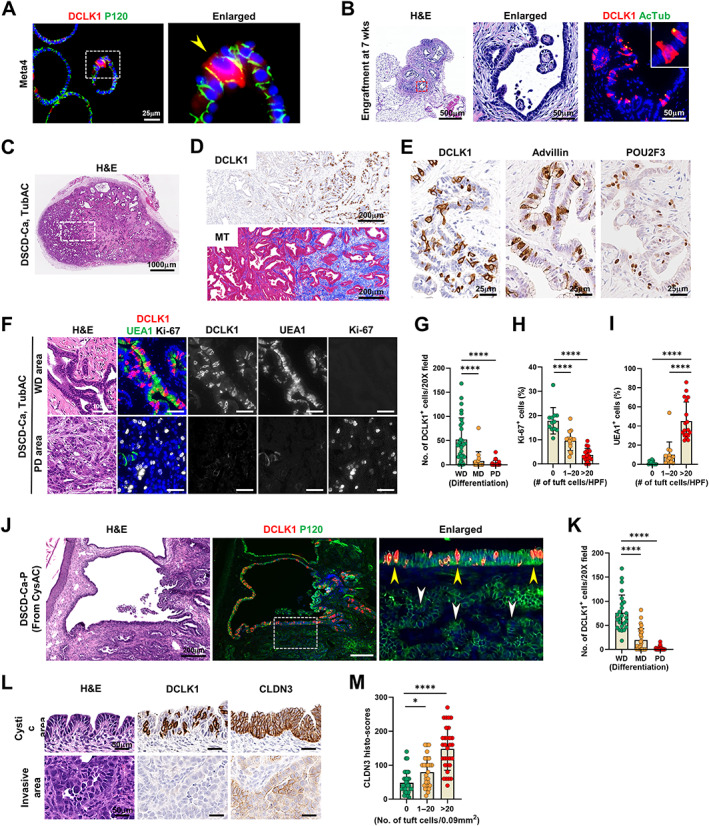
Figure 6.

Tuft cell expansion in mouse dysplastic stem cell‐derived cancers in the nude mice. (A) Co‐immunostaining for DCLK1 and P120 in Meta4 organoids. Yellow arrowhead indicates a DCLK1‐positive tuft cell. (B) H&E and co‐immunostaining for DCLK1 and acetylated tubulin (AcTub) in the engraftment formed at 7 weeks after implanting dysplastic stem cells (D133/CD166 double‐positive cells, DSCs) from Meta4 organoids in the nude mice. Red dotted box depicts enlarged area. (C and D) Representative images of H&E (C), immunostaining for DCLK1 and Masson‐trichrome (MT) staining (D) in DSC‐derived cancer (DSCD‐Ca), histologically tubular adenocarcinoma (TubAC), formed at 13 weeks (wks) after implanting DSCs in the nude mice (n = 8). (E) Immunostaining for DCLK1, advillin, and POU2F3 in TubAC. (F and G) H&E and co‐immunostaining for DCLK1, UEA1, and Ki‐67 in the well‐differentiated (WD) or poorly differentiated (PD) areas in TubAC (F) and quantitation of DCLK1‐positive cells according to differentiation of cancer (G). (H and I) Quantitation of Ki‐67‐poisitive cells (H) and UEA1‐positive cells (I) according to the number of tuft cells at high power field (HPF) in TubAC. (J) H&E and co‐immunostaining for DCLK1 and P120 in passaged DSCD‐Ca (DSCD‐Ca‐P) generated by re‐inoculating cystic adenocarcinoma (CysAC) in nude mice. (K) Quantitation of DCLK1‐positive cells according to differentiation of cancer (n = 8). Yellow arrow heads indicate cystic area harboring many tuft cells, whereas white ones indicate adjacent invasive glands with no tuft cells. (L and M) H&E and immunostaining for DCLK1 and CLDN3 in tuft cell‐rich and ‐poor areas (L) and quantitation of CLDN3 histoscores according to the number of tuft cells at high power field in DSCD‐Ca‐P (n = 8) (M). No., number. Mean ± SD. One‐way ANOVA with Tukey's multiple comparisons test. *p < 0.05, ****p < 0.0001.
