
Figure 6.
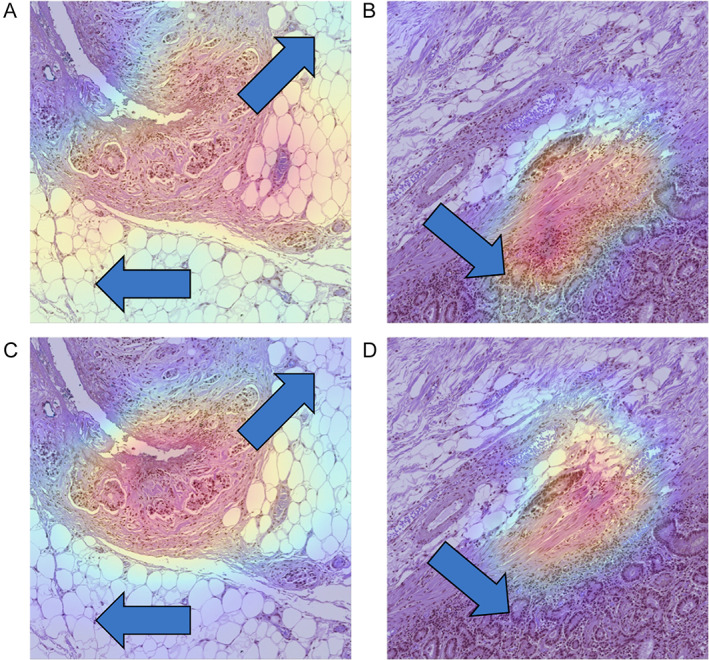
Grad‐CAM visualization of sample patch images. The Grad‐CAM provides insights into the areas of focus of the model. The upper row panels (A, B) depict the Grad‐CAM outputs of the weak models, while the lower row panels (C, D) illustrate the Grad‐CAM outputs of the strong models. Noteworthy, differences between the Grad‐CAM outputs of the weak and strong models are indicated by arrows. The focused area of the strong model appears comparatively compressed, effectively capturing the patterns indicative of LI‐positivity, in contrast to the wide and distributed focus areas observed in the weak models. Furthermore, panel (B) demonstrates the weak model's confusion between gland cell structures and LI‐positive patterns.