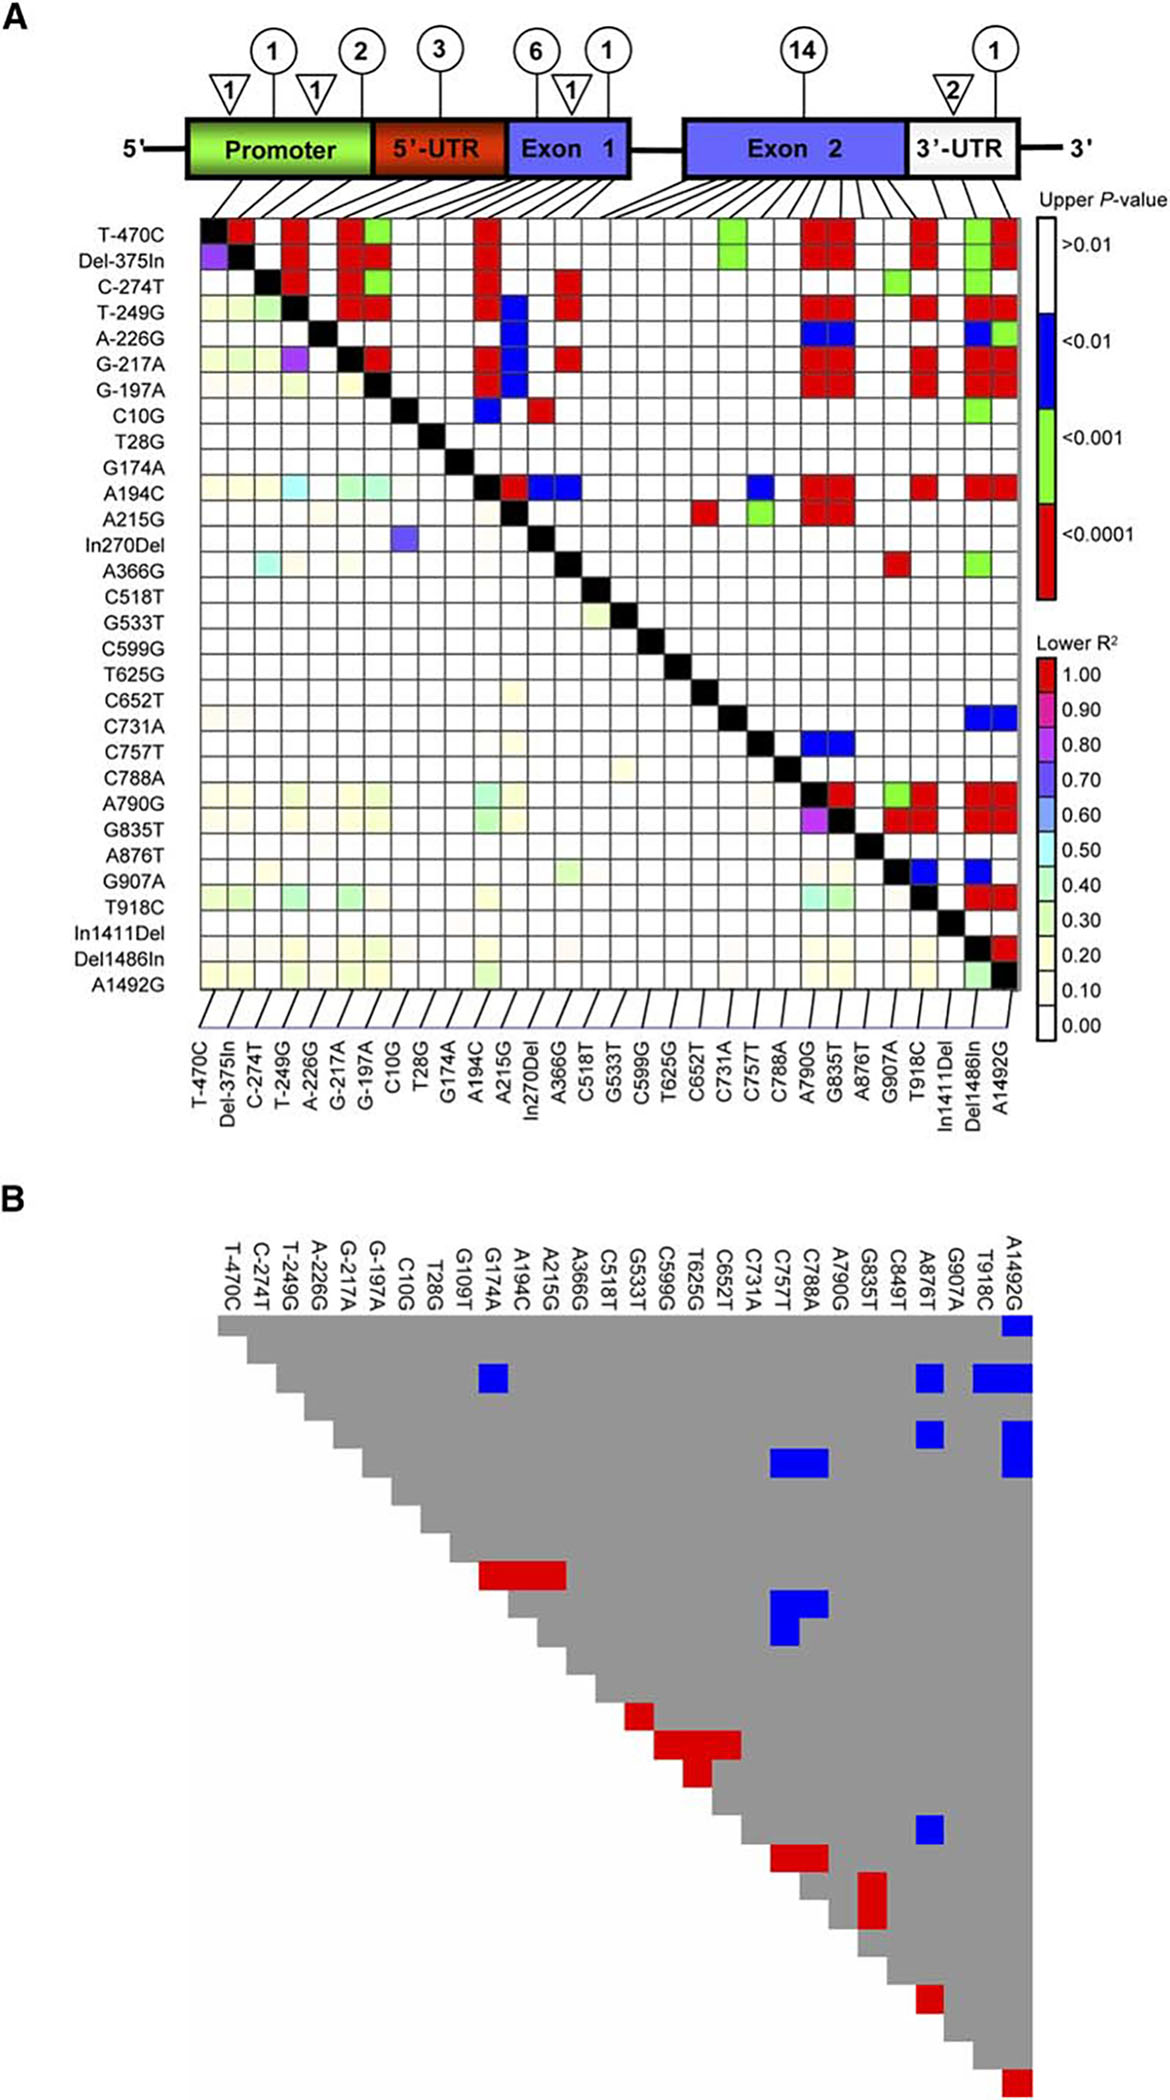
Figure 1.

Catsup Polymorphisms (A) The Catsup gene structure is depicted with the number and distribution of SNPs (circle) and InDels (triangle) in 169 Catsup alleles sampled from the Raleigh population. The promoter region is predicted and not functionally confirmed. LD in Catsup is shown below the gene structure, with p values from Fisher’s Exact Test above the diagonal and estimates of r2 below the diagonal.
(B) Departures of LD in Catsup from the level expected given the maximum likelihood estimate of the population recombination parameter, 4Nr. Red and blue blocks depict pairwise associations that exhibit significantly less LD and significantly more LD, respectively, than expected.
