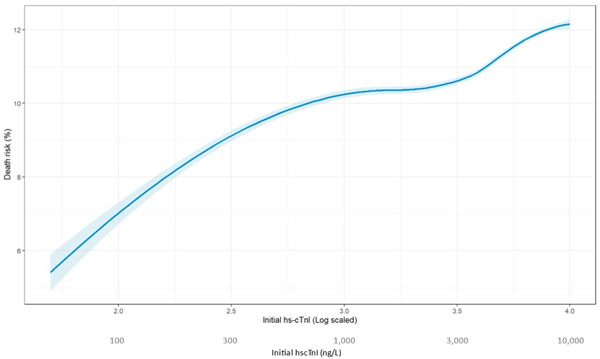
Figure 3.

This graph represented the interpolated risk for mortality at 1 year of presentation, based on initial hs‐cTnI levels. As initial hs‐cTnI levels increased, so is the risk for mortality. A second, later peak, in the death risk is seen when initial hs‐cTnI levels reach the fourth quartile. hs‐cTnI, high‐sensitivity cardiac troponin I.
