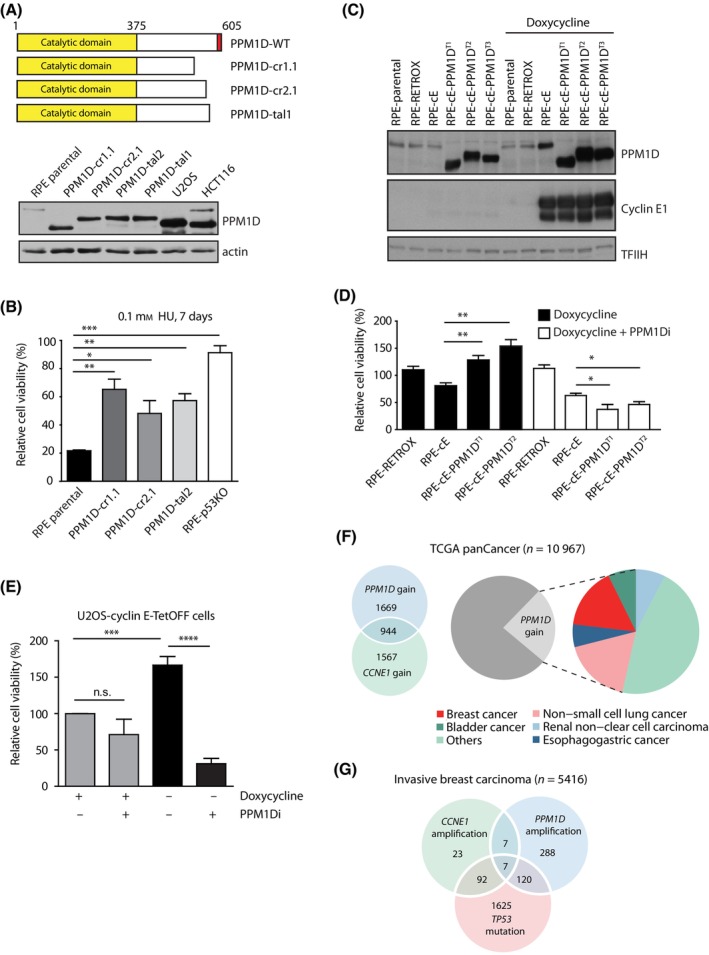
Fig. 1.

PPM1D provides proliferation advantage upon induction of replication stress. (A) Scheme of the RPE1‐PPM1D mutants used in the study. Red rectangle shows localisation of a degron responsible for degradation of PPM1D protein. Note an increased level of the truncated PPM1D in all clones detected by immunoblot of the whole cell extracts. U2OS and HCT116 cells naturally containing the truncated PPM1D alleles are used as controls (n = 1). (B) Parental RPE1 cells, cells carrying truncated PPM1D, and RPE1‐p53KO cells were treated with 0.1 mm HU for 7 days and relative proliferation was determined by resazurin assay. Proliferation was normalized to a condition without HU for each genotype. Statistical significance was evaluated by the two‐tailed t‐test, error bars indicate SDs (n = 3) (*P < 0.05; **P < 0.01; ***P < 0.001). (C) Parental RPE1, RPE1 cells stably transfected with pRetroX‐Tet‐On alone (RPE1‐Retrox) and with pRetroX‐Tight‐Pur‐CCNE1 (RPE1‐cE) cells and their three independent derivatives carrying truncated PPM1DT allele (RPE1‐cE‐PPM1DT1, RPE1‐cE‐PPM1DT2 and RPE1‐cE‐PPM1DT3) were treated or not with doxycycline for 3 days. Whole cell lysates were probed with indicated antibodies (n = 2). Note an increased level of the truncated PPM1D in all clones. (D) RPE1‐cE, RPE1‐cE‐PPM1DT1 and RPE1‐cE‐PPM1DT2 cells were treated or not with doxycycline or a combination of doxycycline and PPM1Di and proliferation was determined after 8 days using resazurin assay. Proliferation was normalized to a condition without doxycyline for each genotype. Statistical significance was evaluated by the two‐tailed t‐test, error bars indicate SDs (n = 4) (*P < 0.05; **P < 0.01). (E) U2OS‐cyclin E‐TetOFF cells were grown in the presence of doxycycline or expression of cyclin E was induced by removal of doxycycline. Where indicated, cells were treated with PPM1Di. Proliferation was determined after 8 days using resazurin assay. Statistical significance was evaluated by the two‐tailed t‐test, error bars indicate SDs (n = 3) (***P < 0.001; ****P ≤ 0.0001). (F) Analysis of TCGA pan‐cancer data set (n = 10 967 unique samples), with the pie chart showing the distribution of top five tumour types over samples with PPM1D gain. Venn diagram shows the intersection of samples with PPM1D and CCNE1 copy number gain. (G) Analysis of cBioportal Invasive Breast Cancer samples (n = 5416 unique samples). Venn diagram indicates intersection of samples with CCNE1 amplification, PPM1D amplification and TP53 mutation.
