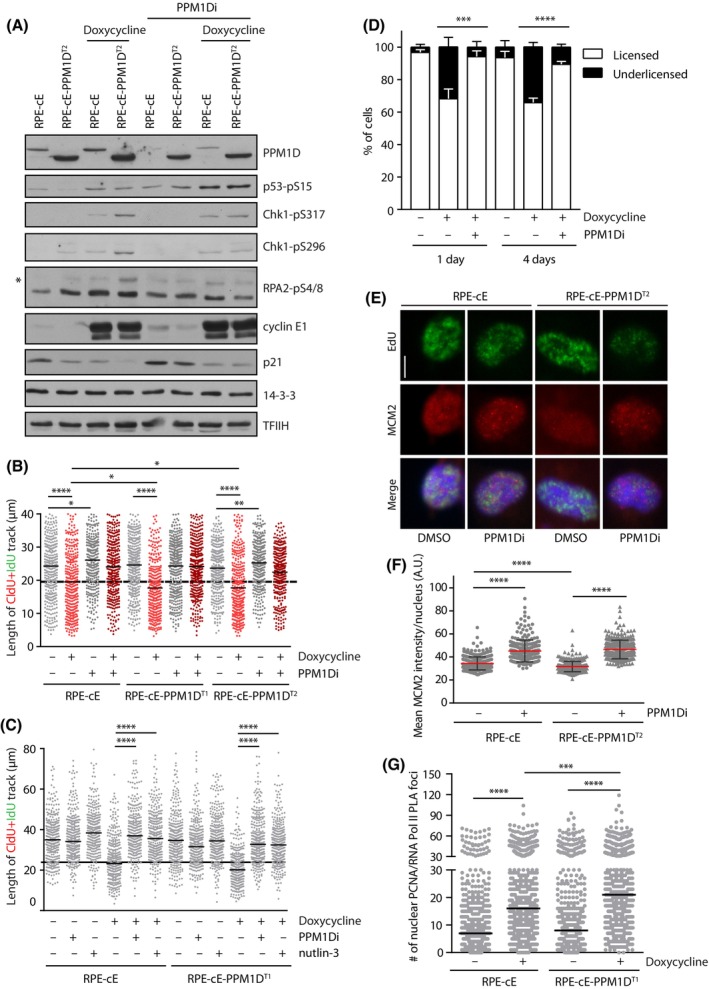
Fig. 3.

PPM1D activity increases the level of replication stress in cells overexpressing cyclin E1. (A) RPE1‐cE and RPE1‐cE‐PPM1DT2 cells were synchronized in mitosis by nocodazole and were released into fresh media containing EdU and supplemented with doxycycline or combination of doxycycline and PPM1Di. Cells were collected at 6‐h postrelease from nocodazole and whole cell lysates were probed with indicated antibodies. Asterisk indicates hyperphosphorylated RPA2. Staining for 14‐3‐3 and TFIIH was used as loading controls. Representative result from two independent experiments is shown. (B) Replication fork progression was determined by DNA fibre assay in RPE1‐cE, RPE1‐cE‐PPM1DT1 and RPE1‐cE‐PPM1DT2 cells treated with doxycycline, PPM1Di or combination of both as indicated. Before harvest, the cells were sequentially pulse‐labelled with CldU and IdU for 30 min each. Plotted is the length of the CldU+IdU tract, black horizontal lines indicate the mean value from three independent experiments (n ≥ 350). Statistical significance was determined by t‐test (*P ≤ 0.05; **P ≤ 0.01; ****P ≤ 0.0001). (C) RPE1‐cE and RPE1‐cE‐PPM1DT1 cells were treated with doxycycline, PPM1Di and nutlin‐3 as indicated and replication fork progression was determined as in B. Plotted is the length of the CldU+IdU tract, black horizontal lines indicate the mean value from three independent experiments (n ≥ 350). Statistical significance was determined by t‐test (****P ≤ 0.0001). (D) RPE1‐cE cells were treated with doxycycline and PPM1Di for 1 or 4 days and with EdU for 30 min prior extraction and fixation. The level of MCM2 in early S phase cells was determined by flow cytometry. Plotted are the fractions of cells with normal (licensed origins) or decreased level of MCM2 (underlicensed origins). Statistical significance was evaluated by the two‐tailed t‐test, error bars indicate SD (n = 4, ***P < 0.005; ****P < 0.0001). (E) RPE1‐cE and RPE1‐cE‐PPM1DT2 cells synchronized in mitosis by nocodazole were released into fresh medium supplemented with EdU, doxycycline and PPM1Di as indicated. After 4‐h postrelease, cells were pre‐extracted, fixed and stained for MCM2 and EdU. Cells were analysed by ScanR microscopy, representative images are shown (n = 3). Bar indicates 5 μm. (F) Quantification of MCM2 levels in EdU+ cells from D. Plotted is the mean nuclear intensity of MCM2 ± SD. Each dot represents a single cell (n = 300). Statistical significance was determined by t‐test. Representative out of three experiments (****P < 0.0001). (G) RPE1‐cE and RPE1‐cE‐PPM1DT1 cells were treated or not with doxycycline and colocalization of PCNA and the elongating form of RNA polymerase II was determined by PLA. Each dot represents a single cell (n = 500). Shown is representative out of three experiments. Statistical significance was determined by t‐test (***P < 0.001; ****P < 0.0001).
