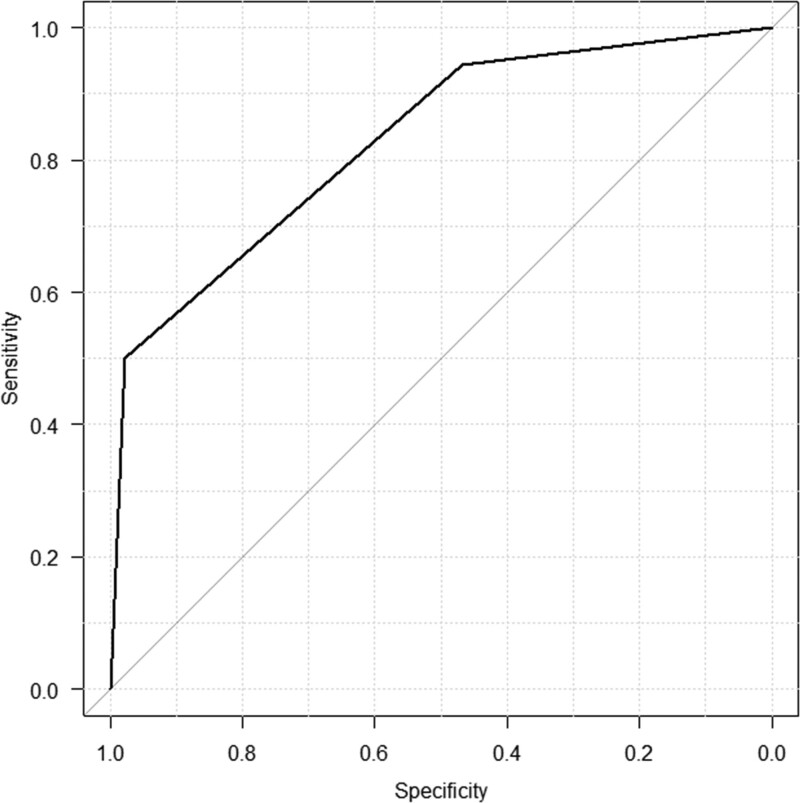
Figure 3.
The ROC curve of the combination of TP ≥ 7.0 g/dL and D-dimer ≥ 11.8 µg/mL for the presence of PE. Each variable was assigned a value of 1 point, thus totaling 2 points. The AUC was 0.829 (95% Cl 0.727–0.931). When the cutoff value was 2 points, the sensitivity, specificity, and odds ratio for this cutoff value were 50.0%, 97.9%, and 42.2 (95% CI 4.91–2030.4), respectively. When the cutoff value was 1 point, the sensitivity, specificity, and odds ratio for this cutoff value were 94.4%, 46.7%, and 14.5 (95% CI 1.95–650.9), respectively. AUC = area under the ROC curve, Cl = confidence interval, ROC = receiver operating characteristic.

