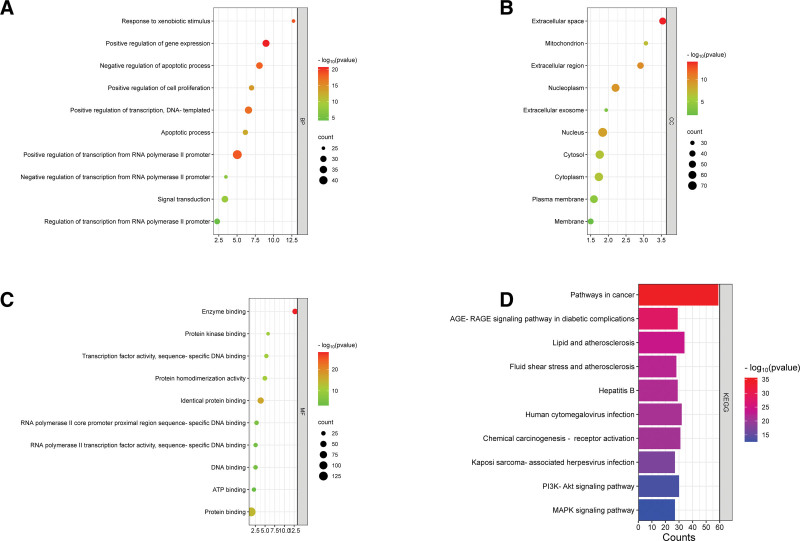
Figure 5.
GO enrichment analysis of key targets and KEGG enrichment analysis. (A) The top 10 significant P values of BP; (B) The first 10 significant P values of CC; (C) The top 10 significant P values of MF; (D) The top 10 significant P values of KEGG pathways. BP = biological process, CC = cellular component, MF = molecular function, KEGG = Kyoto encyclopedia of genes and genomes.

