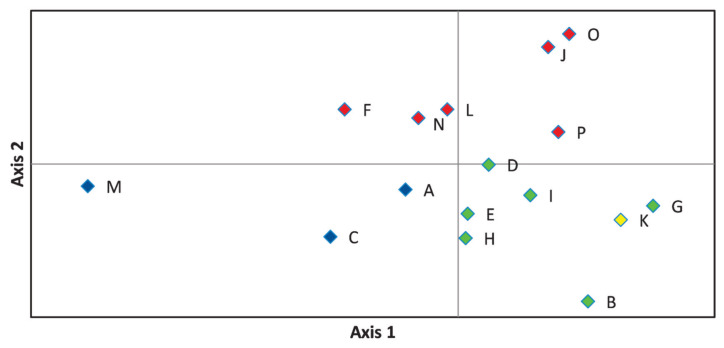
Figure 4.
Representation of principal component analysis of estimated pairwise genetic distance values obtained by Genalex software, where axes 1 and 2 describe 33.68% and 17.88% of the total variance, respectively. Herd groups are marked by their dominant colour as given in Figure 3. Blue colour is for A-C-M. Red is given to F-J-L-N-O-P, green defines B-D-E-G-H-I, yellow denotes herd K.

