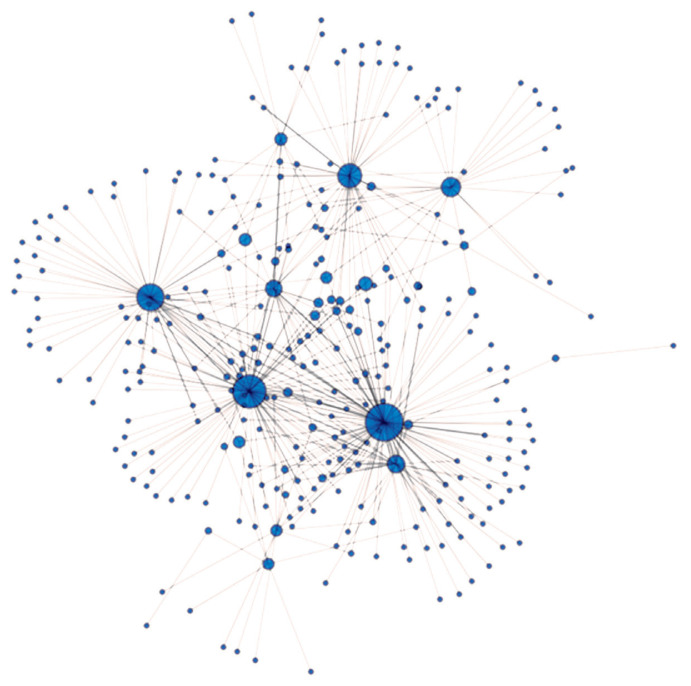
Figure 6.
Genetic net based on identical by state values (IBS). IBS values above 0.624 are presented in the figure. Nodes/circles are the animals from herd A, and connections/edges are the pairwise IBS values between the nodes. The diameter of the nodes/animals is proportional to their betweenness centrality.

