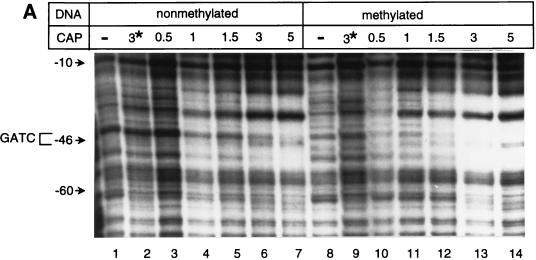
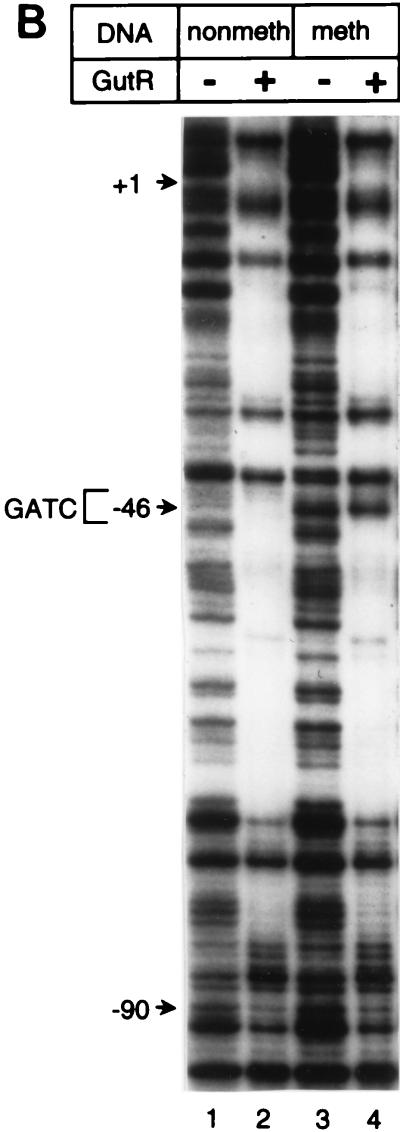
FIG. 3.
DNase I footprint analyses. (A and B) The DNase I footprint of the top strand of gutABD regulatory region DNA with CAP (A) or GutR (B) is shown. Results obtained with nonmethylated gutABD regulatory region DNA (A, lanes 1 to 7; B, lanes 1 and 2) and methylated gutABD regulatory region DNA (A, lanes 8 to 14; B, lanes 3 and 4) are shown. In panel A, the relative levels of CAP added are shown, with 1 being equal to 280 nM. In panel B, a level of GutR sufficient for binding saturation was used. In panel A, lanes 2 and 9, the asterisk indicates that the reactions took place in the presence of 840 nM CAP but in the absence of cAMP. (C) Protection by GutR and CAP of the top DNA strand. Open circles below a base designate DNase I-hypersensitive sites, and thin lines designate protection from DNase I digestion. The asterisk indicates the base (G−46) that was sensitive in methylated DNA but not in nonmethylated DNA. The GATC-44.5 sequence is boxed, and the predicted CAP binding site is underlined with a thick line (30). The numbering of the gut DNA is that of Yamada and Saier (32).


