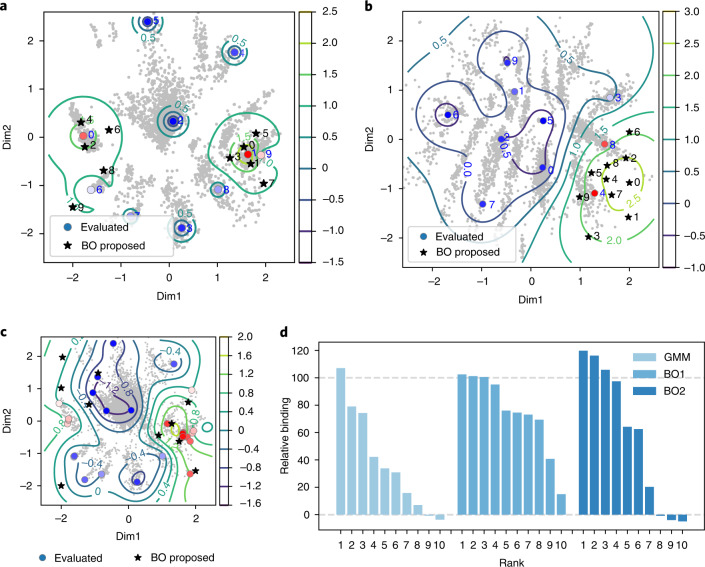
Fig. 6. Results of Bayesian optimization for real data.
a,b, The activity distribution and proposed Bayesian optimization (BO) points for datasets A (a) and B (b). Binding activity data shown in Fig. 4 were embedded into latent space. Gray points indicate latent embeddings shown in Fig. 4. The contour line overlaid on the embeddings indicates the predicted activity level. This is the acquisition function of Bayesian optimization, which is the upper confidence bound of the posterior distribution of the Gaussian process (GP-UCB)52. Ten points were proposed by the Bayesian optimization process with a local penalization function. Circles represent the re-embedded position of the GMM centers. Red and blue indicate high and low binding activity, respectively. Stars represent the locations proposed by Bayesian optimization. c, The embedding space and the next value to be proposed in it. The evaluated sequences are color-coded according to their sequence binding affinities. Black stars represent the next ten proposed points resulting from Bayesian optimization. d, Relative affinities of sequences proposed by different methods; BO1 and BO2 indicate the iterations of Bayesian optimization performed. Rank indicates the within-method activity ranking.

