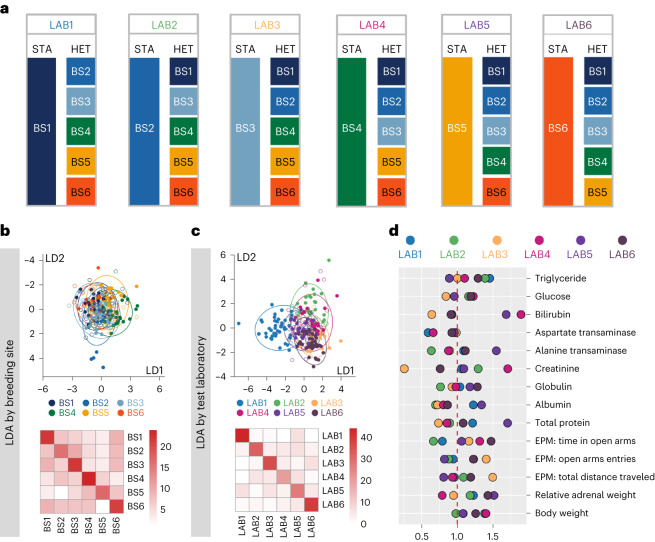
Fig. 1. Effects of heterogenization on phenotypes.
a, Schematic illustration of the multi-laboratory study design. b,c, The phenotype of mice was shaped by both breeding site (b) and test laboratory (c). In the LDA plots, color indicates breeder (b) and test laboratory (c). Filled dots represent a correct classification based on LDA, empty dots represent mismatches. d, Ratio of standard deviations of HET over STA cohorts for each outcome variable and each laboratory. A ratio >1 indicates that variation was larger in the HET compared to the STA cohort. BS, breeding site; LAB, test laboratory; LD, linear discriminant.

