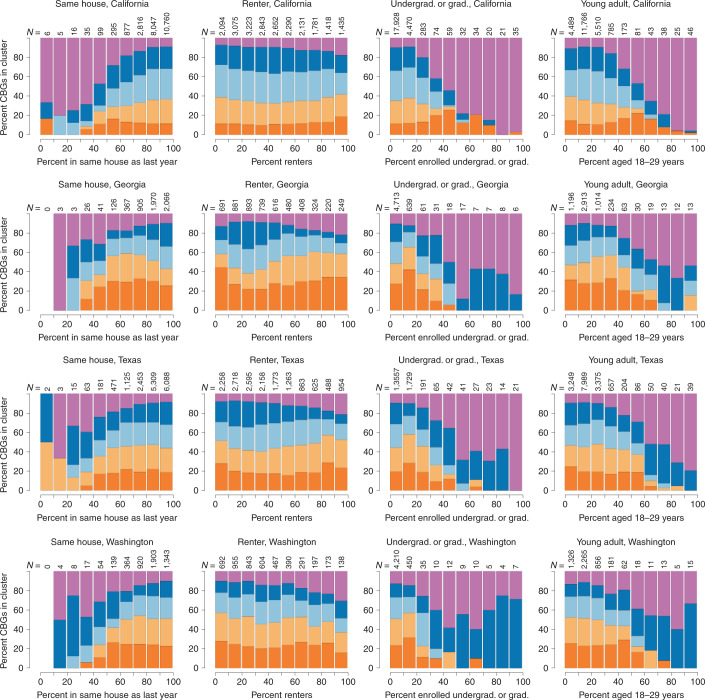
Fig. 4. Proportions of CBGs in each cluster by population characteristics associated with geographic mobility.
The fraction of a CBG’s population associated with the characteristic is plotted on the x axis. CBGs are partitioned into 10 equally spaced bins, defined by the proportion of each CBG’s population having the characteristic in 10% increments. The numbers of CBGs belonging to each bin are printed along the top of each panel. The proportion of CBGs in each cluster is plotted as vertically stacked bars for each bin (with cluster A in dark orange on the bottom through cluster E in purple on the top). Note that some bins contain only a handful of CBGs, so specific proportions should be interpreted with caution.

