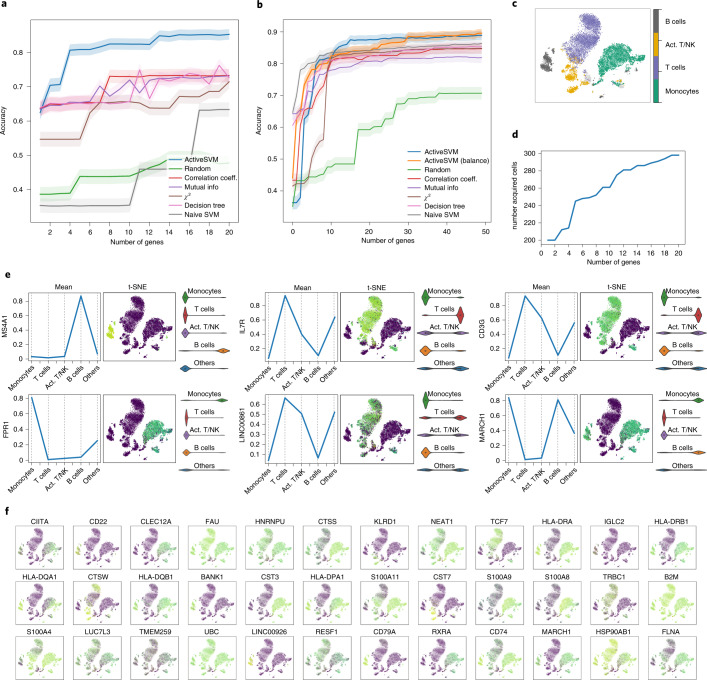
Fig. 2. Gene selection and cell-type classification for PBMC dataset.
a, The test accuracy for min-cell strategy and a series of comparison classification strategies. The min-cell strategy selects k = 20 genes and select c = 100 cells each iteration with confidence interval estimates. b, The test accuracy of min-complexity strategy that selects k = 50 genes using c = 20 cells each iteration. c, The t-SNE plots of the entire filtered dataset. In the legend, Act. T/NK refers to activated T and NK cells. d, The total number of unique cells used versus gene set size with the min-cell strategy. e, Plots showing the expression of several genes markers, including mean on classes, gene expression value on t-SNE projection, and violin plots. f, Expression level of additional selected genes overlaid on t-SNE plot.

