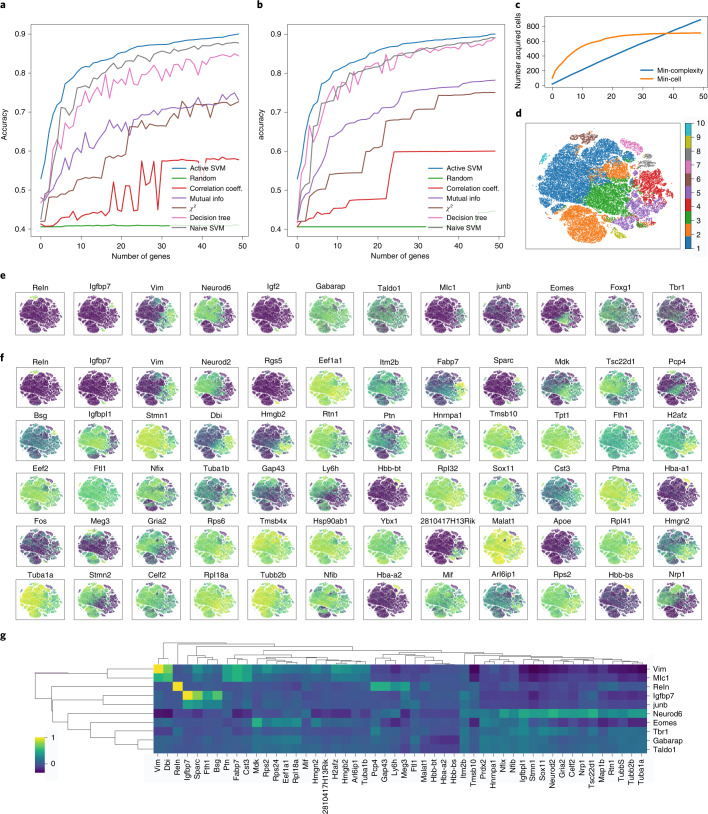
Fig. 3. Scaling of ActiveSVM feature selection to 1.3-million-cell mouse brain dataset.
a, The test accuracy of the min-complexity strategy that selects 50 genes using 20 cells each iteration. b, The test accuracy of the min-cell strategy that selects 50 genes using 100 cells each iteration. c, The total number of unique cells used versus gene set size with both the min-complexity and min-cell strategies. d, The t-SNE plots of the entire filtered dataset with ten classes by k-means clustering. e, Expression level of the gene markers from previously published analysis overlaid on a t-SNE plot. f, Expression level of the gene markers selected by ActiveSVM overlaid on a t-SNE plot, where the first row are the genes that have similar distribution with gene markers from previously analysis and other genes are new markers correlated with the classification target. g, Correlation matrix of literature markers (y-axis) from ref. 8 versus ActiveSVM selected genes (x-axis).

