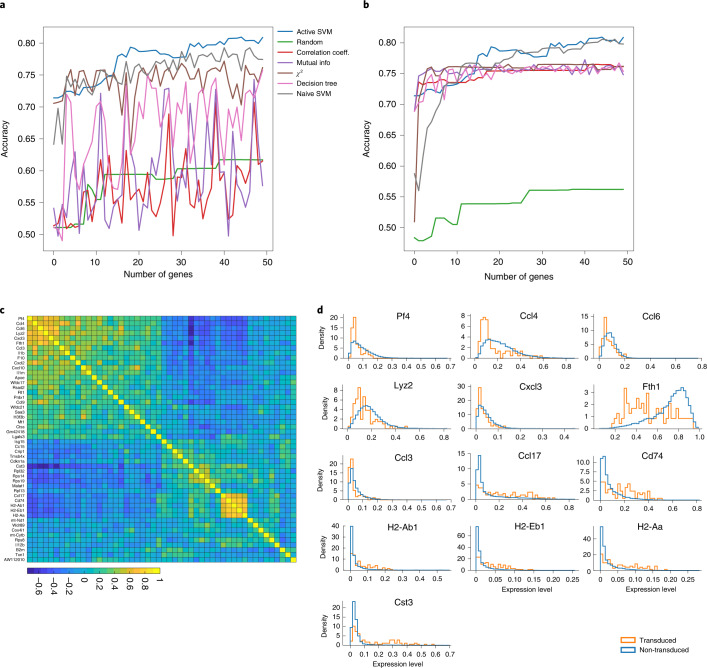
Fig. 6. Application of ActiveSVM to identify genes expression changes following Cebp knock-down with perturb-seq.
The results of classification on perturb-seq data where cells are labeled and classified as Cebp sgRNA transduced or not transduced with a guide RNA. a,b, Accuracy of entire dataset with min-complexity strategy, where comparison methods use the same number of cells as ActiveSVM (a), and use the entire dataset (b). c, Correlation matrix showing pair-wise correlation coefficients for genes in Cebp-perturbed cells. The correlation matrix identifies two gene modules. d, Distributions of gene expression in Cebp sgRNA transduced (orange) or not transduced (blue) cells. Selected genes from modules in c shown and organized so that genes whose expression increases with Cebp perturbation are on top and repressed genes are on the bottom of the figure.

