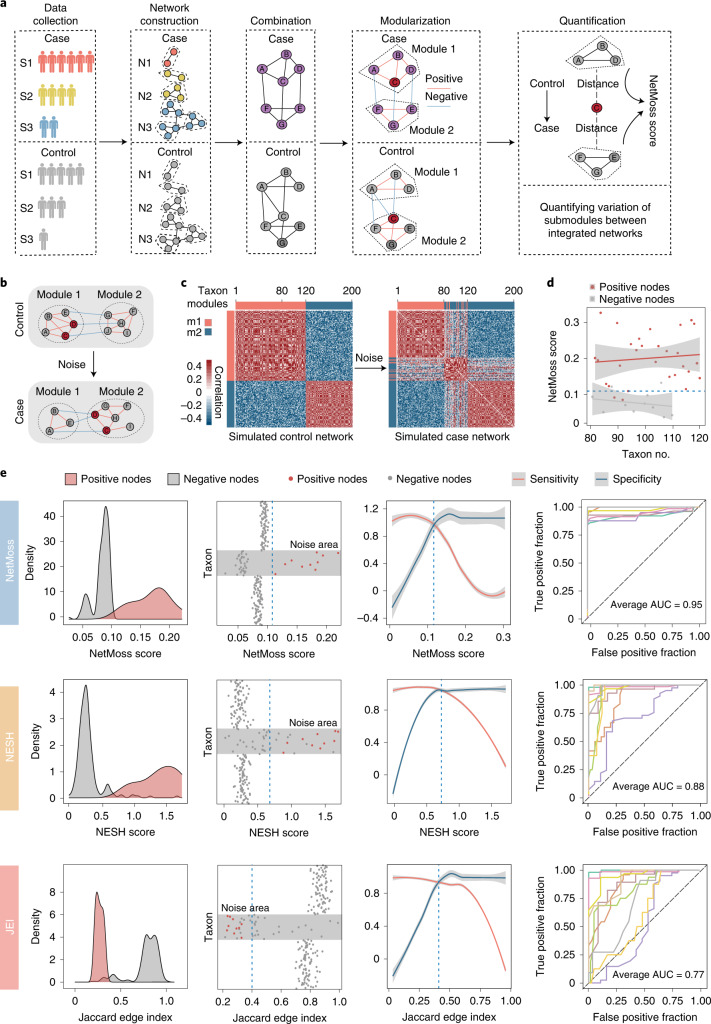
Fig. 3. Identifying differential bacteria using the NetMoss algorithm.
a, Workflow of the NetMoss algorithm. b, Schematic of module transition between control and case networks. c, Module transition based on simulated networks. Random noise was generated and added to the control network (left), constituting the case network (right). The red bar corresponds to module 1 (m1), and the blue bar module 2 (m2). d, NetMoss score of each submodule during the transition of network states in c. The blue dotted line represents the threshold of the NetMoss score in the simulated networks. Submodules with NetMoss scores greater than the threshold correspond to differential network bacteria. Red dots represent submodules that experience transition, and gray dots represent submodules that do not transition. The shaded regions indicate the 95% confidence intervals. e, Comparison of submodule identification among three network-based methods. From top to bottom: NetMoss, NESH and JEI. The two columns on the left represent the density and distribution of submodule scores calculated using the three methods, respectively. In the leftmost column, positive nodes (red) correspond to transited submodules and negative nodes (gray) correspond to others. Gray areas in the taxon plots refer to the noise range added to the taxon. The third column shows the sensitivity (red) and specificity (blue) under different thresholds. The vertical blue dashed line corresponds to the best threshold to distinguish positive and negative nodes, which was determined based on the intersection point of sensitivity and specificity. The gray regions indicate the 95% confidence intervals. The rightmost column represents the prediction power of ten times of replication under different noise levels. Detailed AUC values are shown in Supplementary Table 2.

