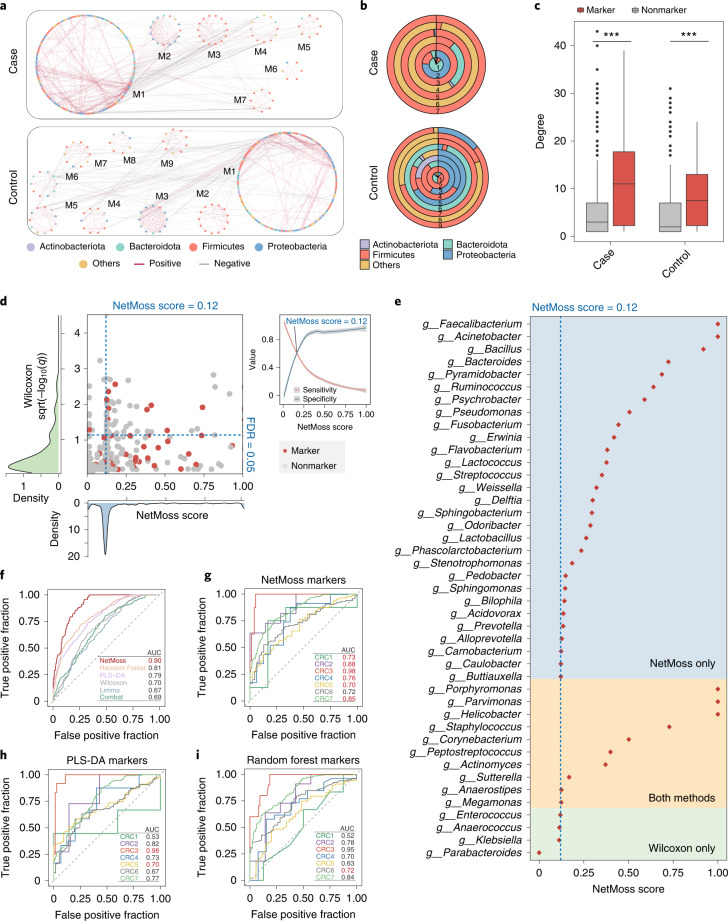
Fig. 4. Application of NetMoss for identifying CRC-associated bacteria.
a, Modules divided by the NetMoss algorithm in case (top) and control (bottom) groups. The color of dots represents bacteria at the phylum level, and the color of edges represents a positive correlation (red) or negative correlation (gray). b, Microbial composition in corresponding modules from the case (top) and control (bottom) groups. Different colors correspond to different phyla. c, Connection strength of each node in the integrated case and control network. Red represents microbial markers in the gutMDisorder database, and gray represents other bacteria. In the box plots: center line, median; box, IQR (the range between the 25th and 75th percentiles); whiskers, 1.5 × IQR; dots, outliers. Two-sided Wilcoxon test. ***P < 0.001; **P < 0.01; *P < 0.05. d, Abundance-based significance or NetMoss score for each genus. Red dots represent microbial markers in the gutMDisorder database, and gray dots represent other bacteria. The two dashed blue lines indicate NetMoss score = 0.12 (vertical) and FDR = 0.05 (horizontal), respectively. The density plots represent the distribution of abundance-based significance (green) or NetMoss score (blue). The small panel on the right refers to sensitivity (red) and specificity (blue) under different thresholds, in which the point of intersection represents the best threshold to distinguish markers and nonmarkers. The gray regions indicate 95% confidence intervals. e, NetMoss score for markers identified by NetMoss only (blue area), Wilcoxon only (green area) or both methods (yellow area). f, Prediction power of six different methods on the combined CRC datasets. The red AUC value shows the best prediction across six methods. g–i, Prediction power of three methods (g, NetMoss; h, PLS-DA; i, Random Forest) on each of the seven separate studies. The red AUC value shows the best prediction of each study across three methods.

