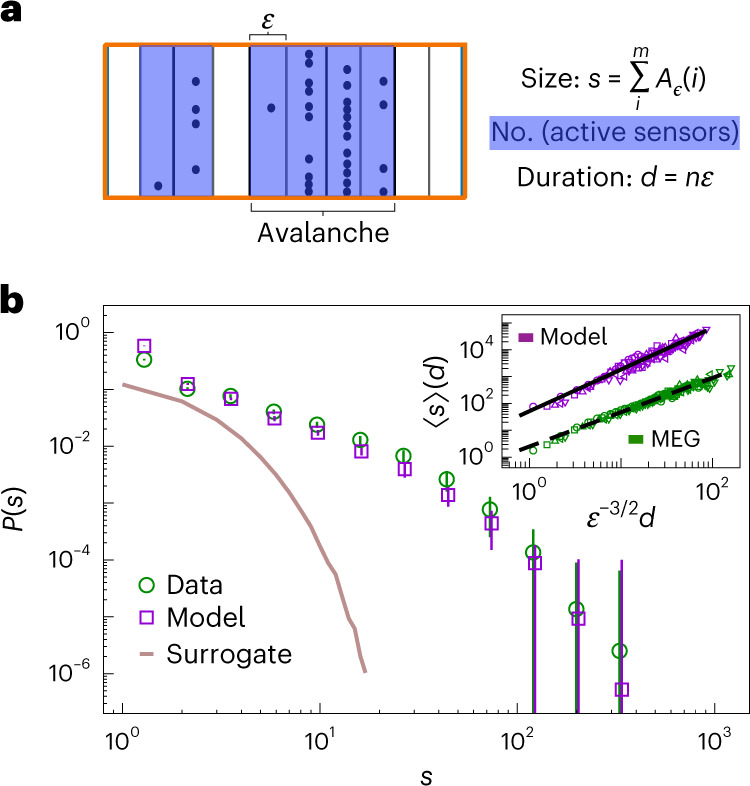
Fig. 4. Reproducing scale-free neuronal avalanches in MEG resting-state activity with a marginally subcritical adaptive Ising model.

a, Schematic representation of a neuronal avalanche. The avalanche size s is the sum of network excitations Aϵ over time bins belonging to the avalanche; its duration, d, is the number of bins multiplied by their duration, ϵ. b, Distribution of avalanche sizes, P(s), for MEG data (the green circles with error bars represent the average over the subjects ± s.d.) and the model simulated at baseline parameters with K = 100 subsystems of nsub = 100 neurons each (the violet squares with error bars represent the average over the model simulations ± s.d.). Both distributions are estimated using e = 2.9 s.d. and ϵ4 = 4T. The brown curve represents the P(s) obtained from the surrogate data (Supplementary Section 1.8) with the same threshold and bin size. The inset shows that the average avalanche size scales with its duration as 〈s〉 ∼ dζ (different plot symbols represent different ϵ, as in Fig. 3; green, MEG data; violet, model simulation; model simulation curves are vertically shifted for clarity) so that the exponent ζ remains independent of ϵ; ζ = 1.28 ± 0.01 for the MEG data (dashed line) and ζ = 1.58 ± 0.03 for the model simulation (thick line). The exponent ζ was estimated via ordinary linear least-square fit y = ax + b, with and .
