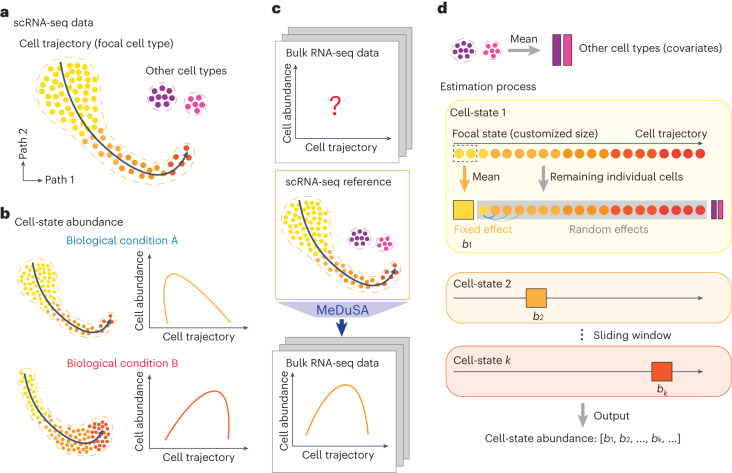
Fig. 1. Schematics of the concept of cell-state trajectory deconvolution and the MeDuSA model.
a, Cells colored in orange are ordered by the cell-state trajectory. b, The distribution of cells along the cell-state trajectory, also known as cell-state abundance distribution, varies under different biological conditions. This distribution can be profiled in scRNA-seq data but is not directly achievable in bulk RNA-seq data. c, MeDuSA is a fine-resolution cellular deconvolution method that leverages scRNA-seq data as a reference to estimate cell-state abundance in bulk RNA-seq data. d, An overview of the cell-state abundance estimation process. Briefly, MeDuSA fits the focal cell-state as the fixed effect, while simultaneously fitting the remaining cells along the trajectory individually as random effects. bk represents the abundance of cells at state k. Further details regarding the MeDuSA method can be found in Methods and sections 1 and 2 of the Supplementary Note.

