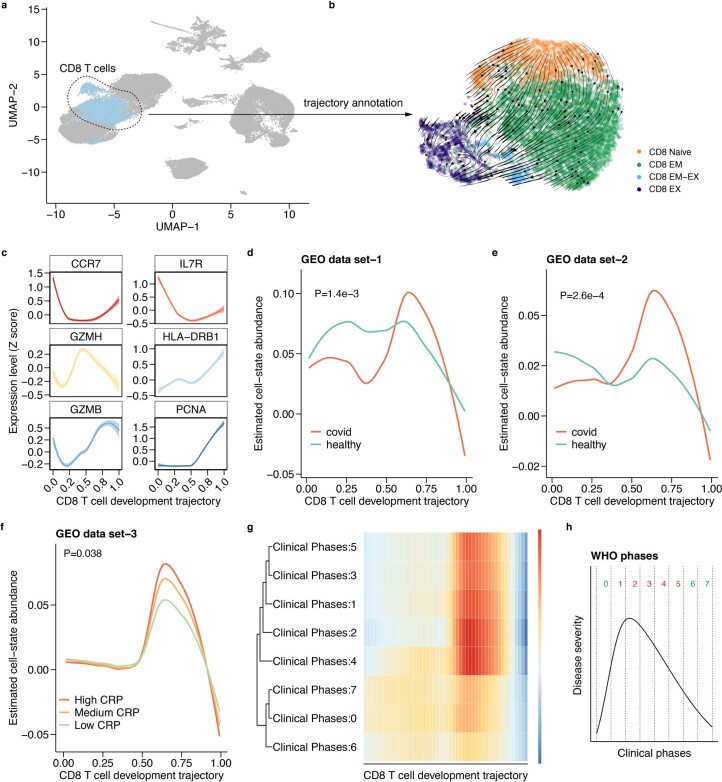
Extended Data Fig. 4. Estimated abundance of CD8+ T cells along the development trajectory in COVID-19.
(a) UMAP embedding of the reference covid-19 scRNA-seq data, where cells are colored according to their cell types (azure, CD8+ T cells). (b) RNA velocity analysis (scVelo) suggesting that CD8+ T cells developed from the naïve state (Tn) to the exhaustion state (Tex). Colors represent subtypes of CD8+ T cells (orange, naive CD8+ T cells; green, effective memory CD8+ T cells; blue, effective-exhaustion transition CD8+ T cells; purple, exhausted CD8+ T cells). (c) Profiling marker genes to confirm the development trajectory. The lines represent the fitted curve using the LOESS, and the shaded area indicates the 95% CI. (d) Estimated cell-state abundances of CD8+ T cells along the development trajectory from bulk RNA-seq data of COVID-19 patients (n = 17) compared with those from healthy donors (n = 17). (e) Replicating the results presented in panel d in an independent bulk RNA-seq dataset (n = 54). (f) Estimated cell-state abundances of CD8+ T cells in COVID-19 patients stratified into tertiles by blood CRP level (n = 100). The x-axis represents the development trajectory, from the naïve state (left) to the exhausted state (right). The curved line shows mean cell-state abundance across individuals. The p values were computed using the permutation-based MANOVA-Pro method. (g) Heatmap of estimated cell-state abundances of CD8+ T cells in eight groups of COVID-19 patients stratified by the WHO clinical phase (n=27). (h) Conceptual illustration of the WHO clinical phase, reflecting disease severity during the SARS-CoV-2 infection.

