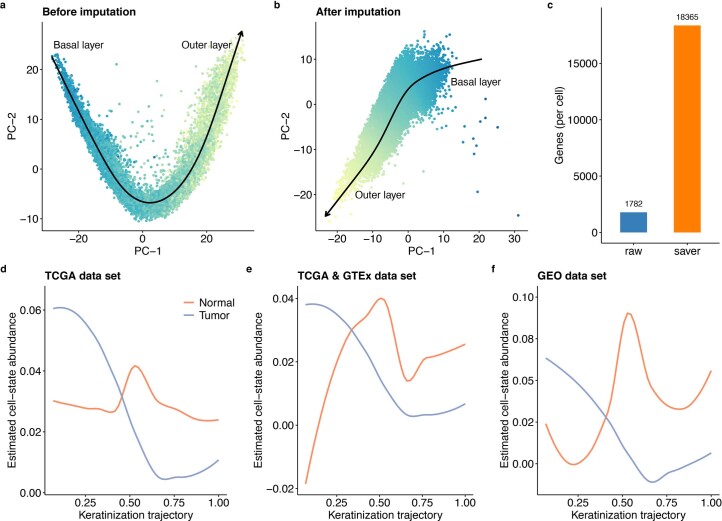
Extended Data Fig. 5. Estimated epithelial abundance along the keratinization trajectory in normal esophagi and tumors.
(a, b) PCA embedding of the reference scRNA-seq data before (panel a) and after (panel b) performing gene expression imputation using SAVER, where cells are colored according to their states. The black arrowed line represents the annotated trajectory using Slingshot, from the basal layer (germinative epithelium) to the outer layer (keratinized epithelium). (c) Number of genes expressed per cell before and after gene expression imputation. We used the SAVER imputed scRNA-seq data as the reference for the cell-state deconvolution analysis below. (d–f) Estimated cell-state abundances of epithelial cells using a dataset from TCGA data (n = 109), a combined set of data from TCGA and GTEx data (n = 664), and a dataset from the GEO (n = 46). The x-axis shows the keratinization trajectory, from the basal layer (left) to the upper layer (right). The curved line represents mean estimated cell-state abundances across individuals.

