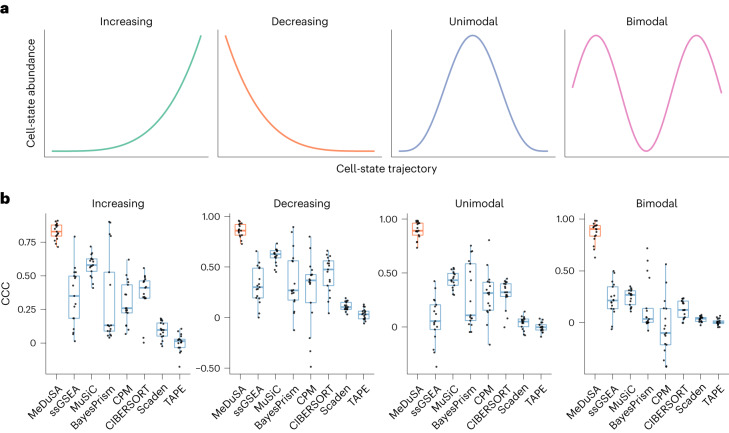
Fig. 2. Benchmarking the cellular deconvolution methods by simulations.
a, Pre-designed distributions of cell abundance along the cell-state trajectory. We generated synthetic bulk RNA-seq data as mixtures of scRNA-seq profiles according to each of the four pre-designed cell-state abundance distributions (‘Simulation strategy’ in Methods). b, Boxplot of CCC (the higher the better) for each deconvolution method. Each dot represents the mean deconvolution accuracy over five replicates for a simulation source dataset. The box indicates the interquartile range (IQR), the line within the box represents the median value and the whiskers extend to data points within 1.5 times the IQR.

