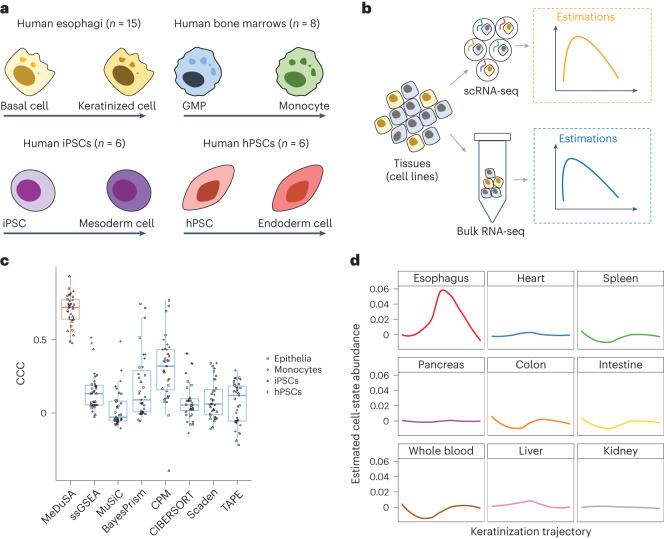
Fig. 3. Benchmarking the cellular deconvolution methods by the analysis of real bulk RNA-seq data.
a,b, Schematic overview of the included datasets (a) and experiment design (b) in real-data benchmark analysis. GMP, granulocyte-monocyte progenitor cells. c, Boxplot of CCC for each deconvolution method. We benchmarked the performance of the methods using sample-matched bulk RNA-seq and scRNA-seq data from four different tissues or cell lines (n = 35). Each dot represents the deconvolution accuracy (measured by CCC) for a sample, with the shape indicating the corresponding tissue or cell line. The box indicates the IQR, the line within the box represents the median value and the whiskers extend to data points within 1.5 times the IQR. d, The estimated epithelia abundance along the keratinization trajectory in the GTEx tissues. The x axis represents the keratinization trajectory, and the curved line shows the mean cell-state abundance across individuals.

