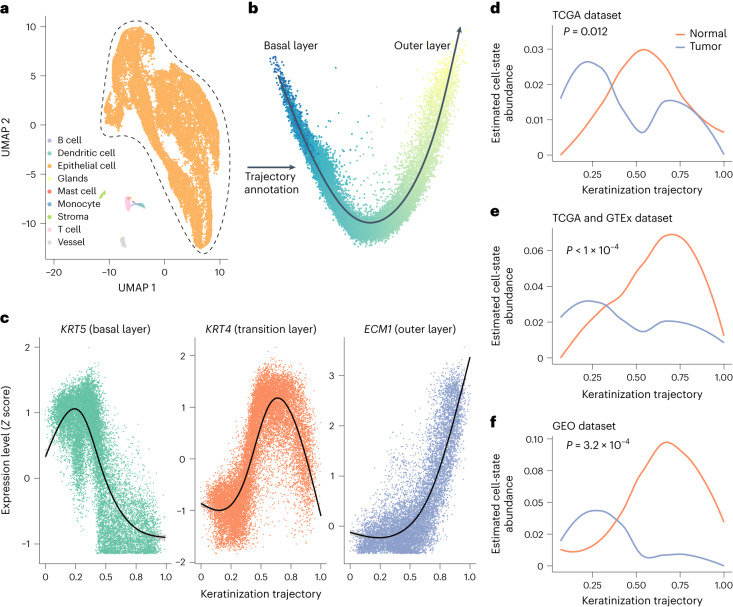
Fig. 4. Estimated epithelia abundance along the keratinization trajectory in normal and tumor esophagus tissues.
a, Uniform manifold approximation and projection (UMAP) embedding of the reference esophagus scRNA-seq data, where cells are colored according to their cell types (orange, epithelia). b, The keratinization trajectory of the epithelia in the reference scRNA-seq data. The black arrowed line represents the annotated trajectory using Slingshot, from the basal layer (germinative epithelium) to the outer layer (keratinized epithelium). c, The expression pattern of KRT5 (marker gene of the basal layer), KRT4 (marker gene of the transition layer) and ECM1 (marker genes of the outer layer) confirmed the keratinization trajectory. The black lines represent the fitted curve using the LOESS and the shaded area indicates the 95% CI. d–f, The cell-state abundance of epithelia estimated by MeDuSA using a dataset from TCGA (d, n = 109), a combined set of data from TCGA and GTEx (e, n = 664) and a dataset from the Gene Expression Omnibus (GEO) (f, n = 46). Batch effects between the GTEx and TCGA datasets were adjusted using Combat-seq. The x axis represents the keratinization trajectory, from the basal layer (left) to the outer layer (right). The curved line shows mean cell-state abundance across individuals. The P values were computed using the permutation-based MANOVA-Pro method.

