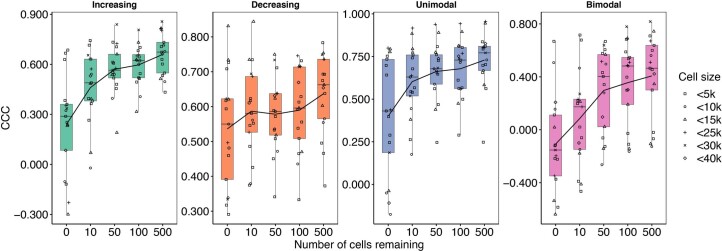
Extended Data Fig. 1. Deconvolution accuracy of MeDuSA-NS with decreasing number of cells fitted in the random-effect component.
We grouped cells of the focal cell type into ten uniformly distributed cell bins over the cell-state trajectory and randomly sampled a subset of cells from each cell bin to be fitted in the random-effect component of the MeDuSA-NS model. The x-axis is the number of cells fitted in the random-effect component. Each dot represents the mean deconvolution accuracy over five replicates for one simulation source data, colored by the number of cells in the data. The box indicates the interquartile IQR, the line within the box represents the median value, and the whiskers extend to data points within 1.5 times the IQR.

