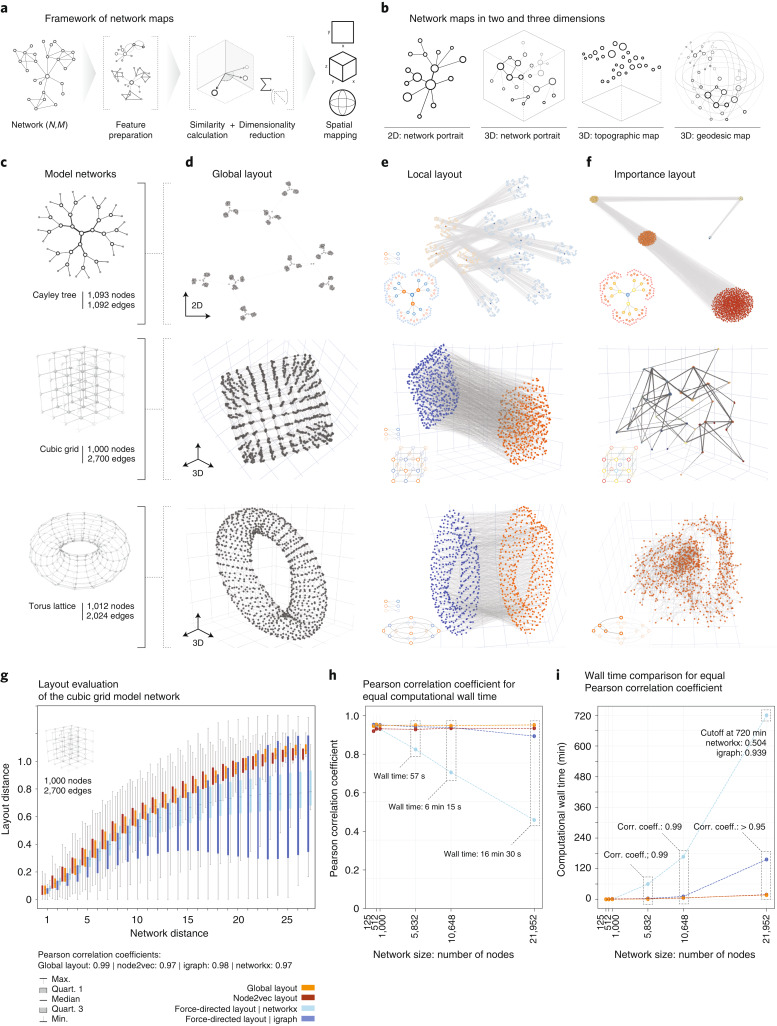
Fig. 1. Framework of interpretable network maps.
a, Overview. A node similarity matrix reflecting any network features to be visually represented is embedded into 2D or 3D geometries using dimensionality reduction methods. b, Schematic depiction of the resulting four types of network map: 2D and 3D network portraits directly use the outputs of the dimensionality reduction; topographic and geodesic maps incorporate an additional z or radial variable, respectively. c, The network models used for benchmarking: Cayley tree, cubic grid and torus lattice. d–f, Model network portraits based on global (d), local (e) and importance (f) layouts. The global layouts recapitulate the expected global shape according to pairwise node distances. The local layouts reveal bi- and multipartite network structures. The importance layouts cluster nodes with similar structural importance. g, Comparison of network-based and Euclidean layout distance for all node pairs in a cubic grid (N = 1,000) for the global layout, two force-directed algorithms and node2vec. All layouts achieve high correlation (Pearson’s ρglob = 0.99, ρnode2vec = 0.97, ρforce,nx = 0.97, ρforce,igraph = 0.98). Boxes summarize values of all n node pairs at network distance d, with n ranging from n = 4 at distance d = 27 (for corner node pairs) to n = 46,852 for d = 9. Whiskers denote the values for the minimum, first, second and third quartiles and maximum. h, Comparison of the final correlations for cubic grids of increasing size when limiting the wall clock running time of the algorithms to the running time of the global layout. i, Computational wall times that the respective algorithms require to achieve the same correlation as the global layout for cube grids of increasing size.

