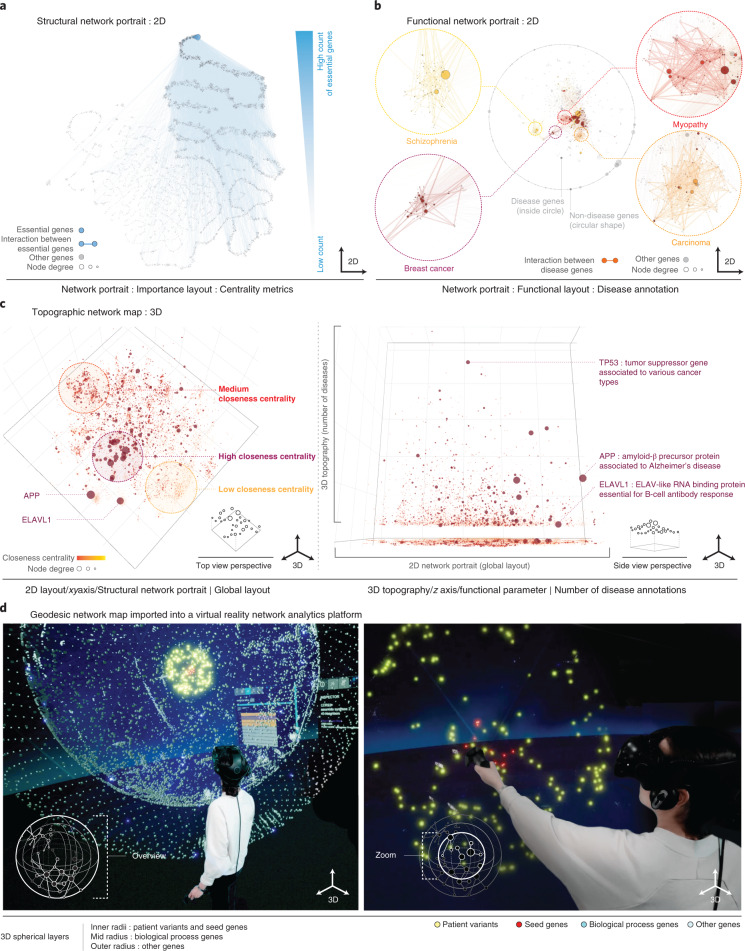
Fig. 2. Application to a large-scale, real-world biological network.
a, Structural network portrait of the human interactome based on the importance layout. Essential genes and links between them are shown in blue and aggregate in the area of high centrality nodes (top right). b, Functional network portrait based on disease association similarity. Four diseases are highlighted. Only links between disease genes are shown. Although most disease genes are located in four clusters (links shown by thicker lines), a smaller number of pleiotropic genes associated with multiple diseases is located at the center of the network (Extended Data Fig. 4b). c, Topographic network map in top view (left) and side view (right) obtained from a 3D interactive visualization. The x–y plane is based on a 2D global layout, and the z axis displays the number of diseases associated with a particular gene. d, Green-screen composition of a user exploring a geodesic network map in a virtual reality environment13. Nodes are distributed on different spherical layers that reflect different biological roles. The center contains nodes to be functionally annotated, the enclosing layers contain genes associated with similar diseases and involved in relevant biological processes, respectively. Each individual layer is based on a functional layout emphasizing biological similarity, allowing the user to quickly identify the biological context of individual genes and their interactome neighborhood.

