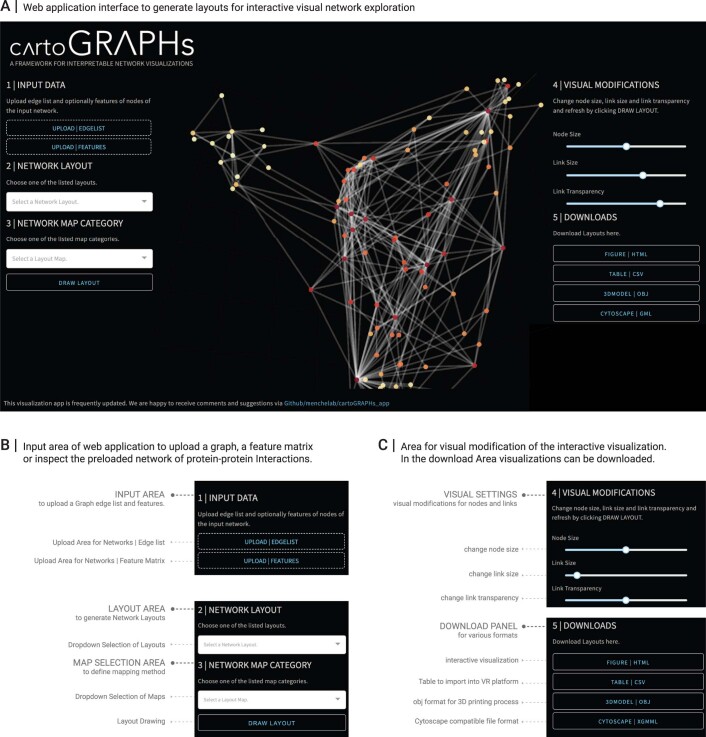
Extended Data Fig. 7. A Web application interface of the CartoGRAPHs framework.
A Screenshot of the web application. B Input area for uploading network and functional node annotation data, selecting layouts and mapping types. C Areas for adapting the visualization and for downloading the final layouts in different formats, including interactive html files, XGMML files for further processing in the cytoscape software, and files for import into 3D softwares or a virtual reality (VR) analytics platform.

