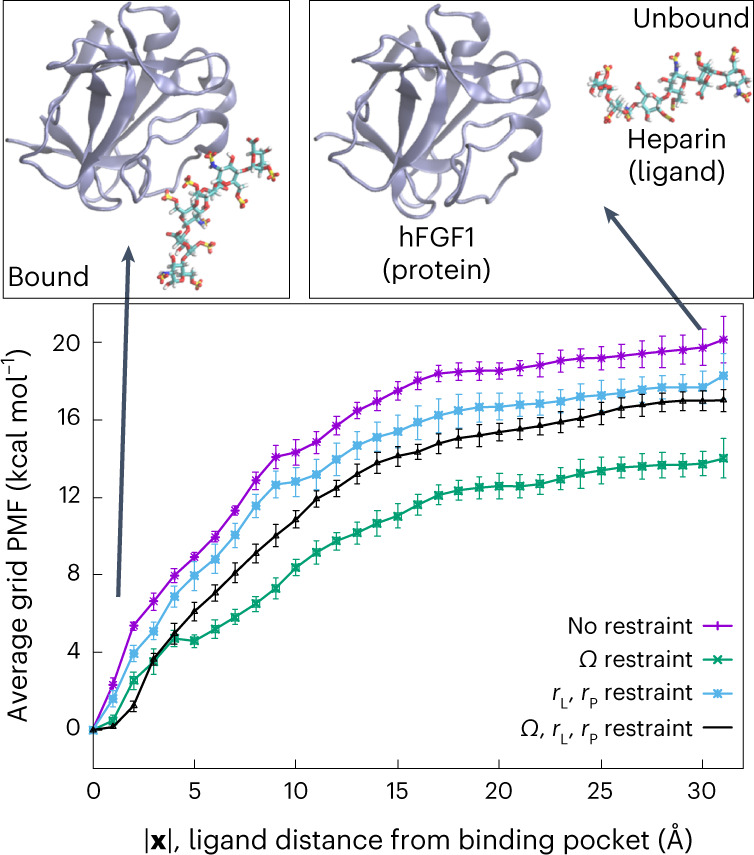
Fig. 1. Average grid PMF based on our alternative distance-based BEUS simulations.

Average grid PMFs in terms of |x|, where x is the three-dimensional position vector of the ligand with respect to the center of the binding pocket. The x axis represents |x| and the y axis represents ΔF(|x|), which is an average over all ΔF(x) with the same |x|, that is, the ligand distance from the center of the binding pocket. The error bars represent the standard deviation obtained from all values of ΔF(x) at various grid points x with the same |x|. Representative images of heparin hexasaccharide bound to hFGF1 (|x| = 0 Å) and unbound (|x| = 30 Å) are shown above the grid PMF plot. We used n = 31 MD replicas to generate the data in all cases.
