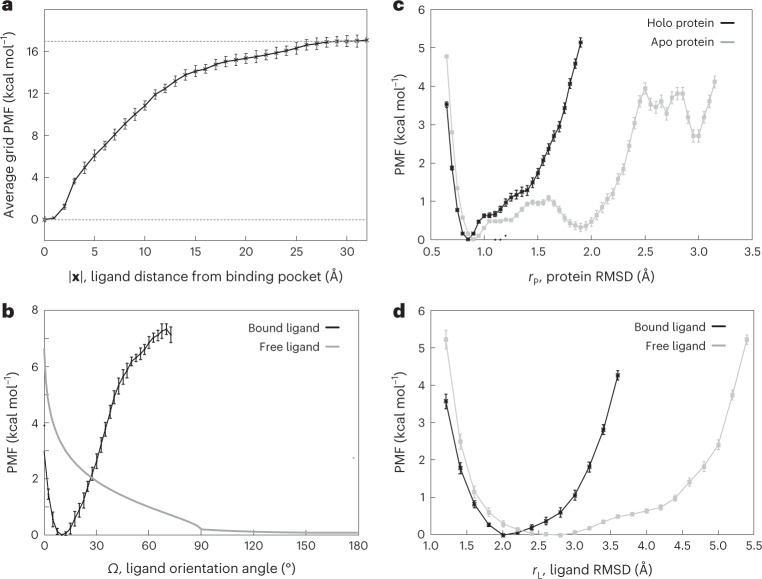
Fig. 2. Computational heparin–hFGF1 binding-free-energy measurements.
a, Average grid PMF in terms of |x|, where x is the three-dimensional position vector of the ligand with respect to the center of the binding pocket determined from distance-based BEUS simulations with Ω, rL and rP restraints. The x axis represents |x| and the y axis represents , which is an average over all with the same |x|, that is, the ligand distance from the center of the binding pocket. The error bars represents the standard deviation obtained from all values of at various grid points x with the same |x|. The dashed line represents the value associated with at |x| = 30 Å. b, The PMF associated with the ligand orientation angle (Ω) for the bound heparin (that is, x ≈ 0, ligand in the binding pocket) and free heparin (that is, x ≈ xB, ligand in the bulk). The latter is calculated analytically with the help of relation (21). c,d, PMF in terms of internal conformational fluctuations of the protein and ligand. c, PMF associated with the internal RMSD of heparin-bound (black line) and apo (gray line) hFGF1 (rP). d, PMF associated with the internal RMSD of FGF1-bound (black line) and free (gray line) heparin hexasaccharide (rL). The error bars in b–d represent the standard deviation determined from the bootstrapping algorithm described in Methods. We used n = 31, n = 30 and n = 12 MD replicas to generate the data shown in a, b, and c and d, respectively.

