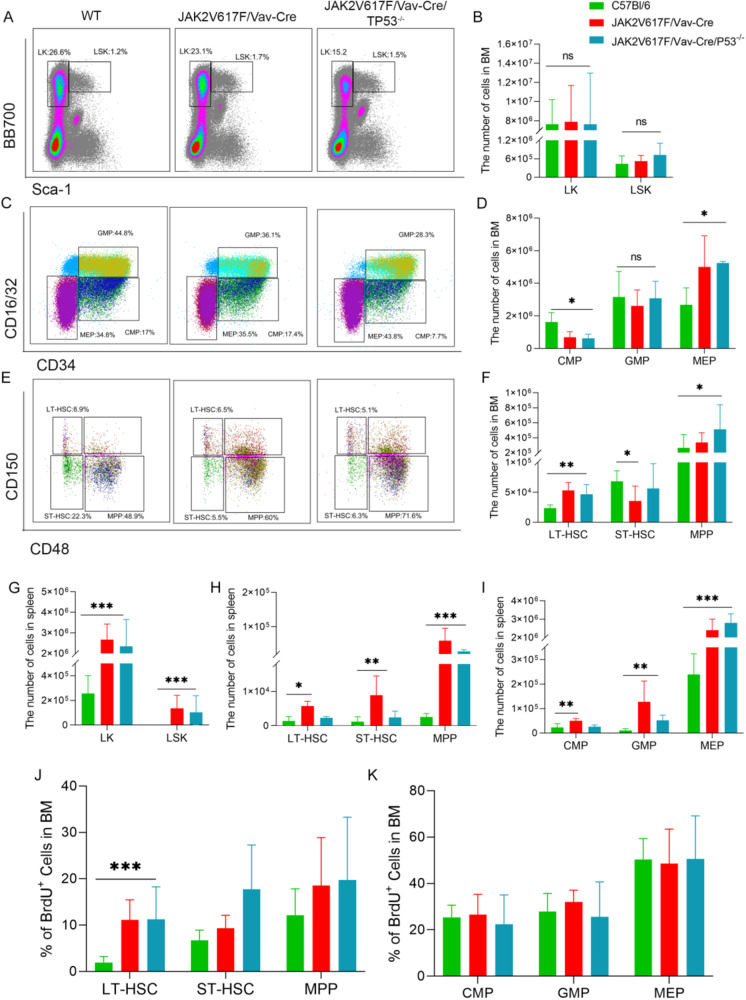
Fig. 2. Inactivation of Trp53 does not lead to expansion of immature progenitors in JAK2V617F mice.
A Representative flow cytometric plots of LK (Lin−sca−c-kit+) and LSK (Lin−sca+c-kit+) cell percentages from the bone marrow (BM) of C57B/l, JAK2V617F/Vav-Cre, and JAK2V617F/Vav-Cre /Trp53−/− mice. B The total number of LK and LSK cells from the BM of C57B/l, JAK2V617F/Vav-Cre, and JAK2V617F/Vav-Cre /Trp53−/− mice. Graph represents pooled mice from three independent experiments, each with 3-4 mice per genotype. C Representative flow cytometric plots of CMP (Lin+sca+c-kit+CD34+CD16/32), GMP (Lin+sca+c-kit+CD34+CD16/32+), and MEP (Lin+sca+c-kit+CD34−CD16/32−) cell percentages from the BM from C57B/l, JAK2V617F/Vav-Cre, and JAK2V617F/Vav-Cre/Trp53−/− mice. D Total numbers of LT-HSC, ST-HSC, and MPP cells from the BM of C57B/l, JAK2V617F/Vav-Cre, and JAK2V617F/Vav-Cre /Trp53−/− mice. Graph represents three independent experiments, each with 3-4 mice per genotype. E Representative flow cytometric plots of LT-HSC (Lin−sca+c-kit+CD150−CD48−), ST-HSC (Lin−sca+c-kit+CD150+CD48−), and MPP (Lin−sca+c-kit+CD150−CD48+) cell percentages from the BM of C57B/l, JAK2V617F/Vav-Cre, and JAK2V617F/Vav-Cre /Trp53−/− mice. F Total numbers of CMP, GMP, and MEP cells from the BM of C57B/l, JAK2V617F/Vav-Cre, and JAK2V617F/Vav-Cre /Trp53−/− mice. Graph represents pooled mice from three independent experiment, each with 3-4 mice per group. G The total number of LK and LSK cells from the spleen of C57B/l6, JAK2V617F, and JAK2V617F/p53−/− mice. H The total number of CMP, GMP, and MEP cells from the spleen of C57B/l6, JAK2V617F/Vav-Cre, and JAK2V617F/Vav-Cre /Trp53−/− mice. Graph represents pooled mice from three independent experiment, each with 3-4 mice per genotype. I The total number of LT-HSC, ST-HSC, and MPP cells from the spleen of C57B/l6, JAK2V617F/Vav-Cre, and JAK2V617F/Vav-Cre /Trp53−/− mice. Graph represents pooled mice from three independent experiment, each with 3-4 mice per genotype. J The percentage of BrdU+ cells of LT-HSC, ST-HSC, and MPP from the BM of C57B/l6, JAK2V617F/Vav-Cre, and JAK2V617F/Vav-Cre /Trp53−/− mice. Graph represents pooled mice from three independent experiment, each with 3-4 mice per genotype. K The percentage of BrdU+ cells of CMP, GMP, and MEP from the BM of C57B/l6, JAK2V617F/Vav-Cre, and JAK2V617F/Vav-Cre /Trp53−/− mice. Graph represents pooled mice from three independent experiment, each with 3-4 mice per genotype. Data are mean ± SD *p < 0.05, **p < 0.01, ***p < 0.001.

