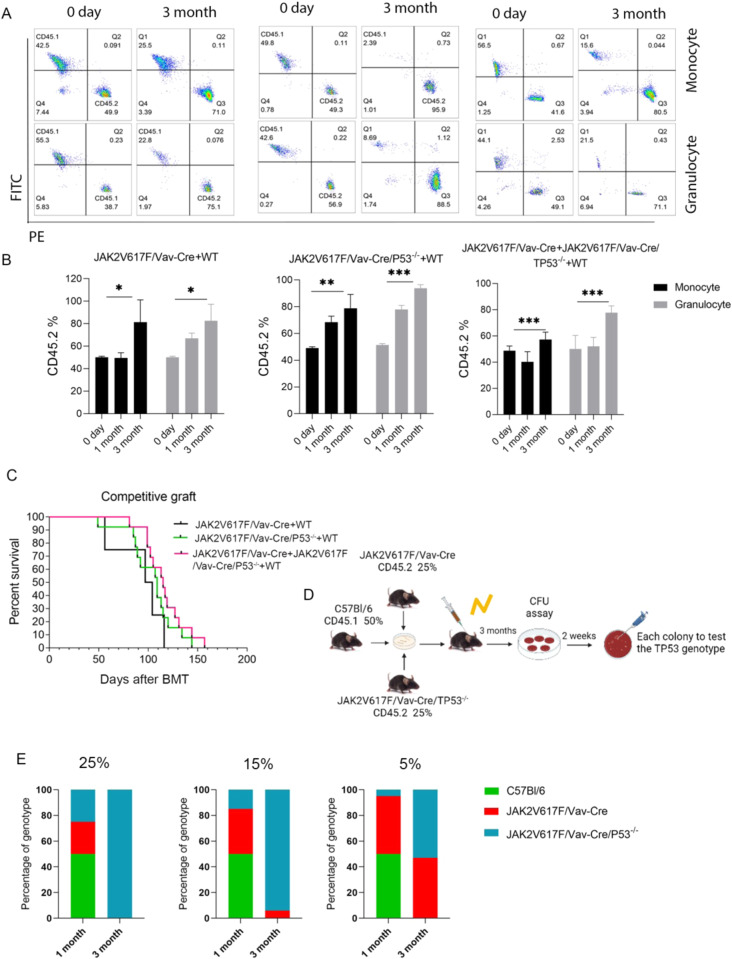
Fig. 3. Competitive graft of JAK2V617/Vav-Cre F and JAK2V617F/Vav-Cre /Trp53−/− murine cells.
A Representative flow cytometric plots of CD45.1 and CD45.2 at different time points (day 0 and month 3) of JAK2V617F/Vav-Cre (50%) + wild type (WT) (50%) competitive graft (left), JAK2V617F/Vav-Cre /Trp53−/− (50%) + WT (50%) competitive graft (middle), and JAK2V617F/Vav-Cre (25%) + JAK2V617F/Vav-Cre /Trp53−/− (25%) + WT (50%) competitive graft from at least two independent experiments. B The percentage of CD45.2 in competitive graft groups, each with 7-10 mice per genotype. C The survival of different competitive graft groups. D The schematic of triple competitive graft. E The percentage of genotyping in different competitive grafts from at least two independent experiments. The group of 25% JAK2V617F/Vav-Cre (25%) + JAK2V617F/Vav-Cre /Trp53−/− (25%) + WT(50%) (left); the group of 15% JAK2V617F/Vav-Cre (35%) + JAK2V617F/Vav-Cre /Trp53−/− (15%) + WT(50%) (middle); the group of 5% JAK2V617F/Vav-Cre (45%) + JAK2V617F/Vav-Cre /Trp53−/− (5%) + WT (50%) (right). Data are mean ± SD *p < 0.05, **p < 0.01, ***p < 0.001.

