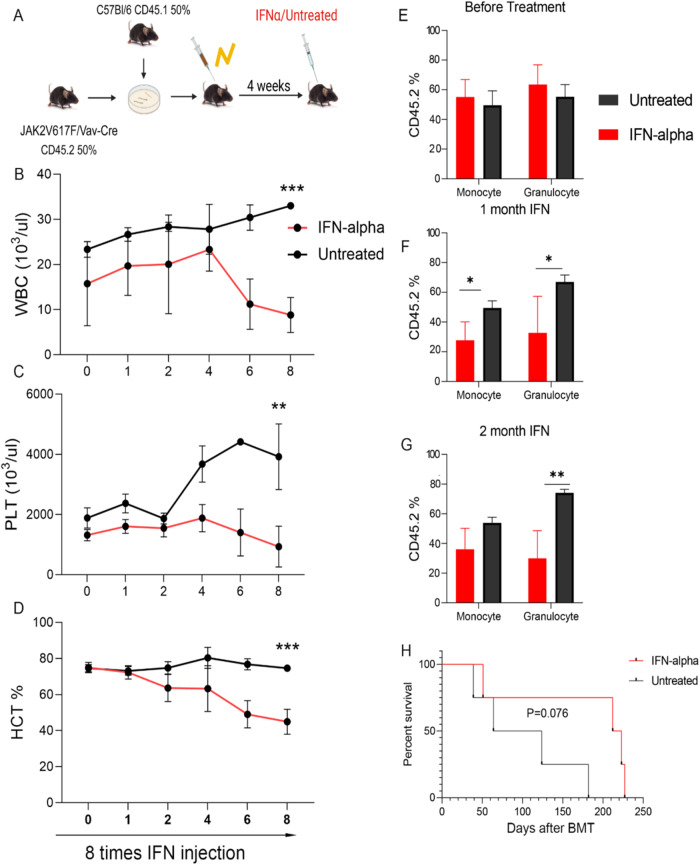
Fig. 5. JAK2V617F/Vav-Cre mice respond to the interferon-α (IFN-α) treatment.
A The schematic of the experiment. B–D The number of peripheral blood (PB) between IFN-α treatment and untreated mice in JAK2V617F/Vav-Cre donor mice and CD5.1 donor mice. B The number of white blood cells (WBC). C The number of platelets (PLT). D The percentage of hematocrit (HCT). Graph represents at least two independent experiments of each time point, each with 4 to 5 mice per group. E–G The percentage of CD45.2 (JAK2V617F/Vav-Cre cells) in blood chimerism of treated and untreated mice. Graph represents at least two independent experiments of each time point, each with 4 to 5 mice per group. E before treatment, F after 1 month of IFN treatment, and G after 2 months of IFN treatment. H The survival of treated and untreated mice. Data are mean ± SD *p < 0.05, **p < 0.01, ***p < 0.001.

